Fig. 5.
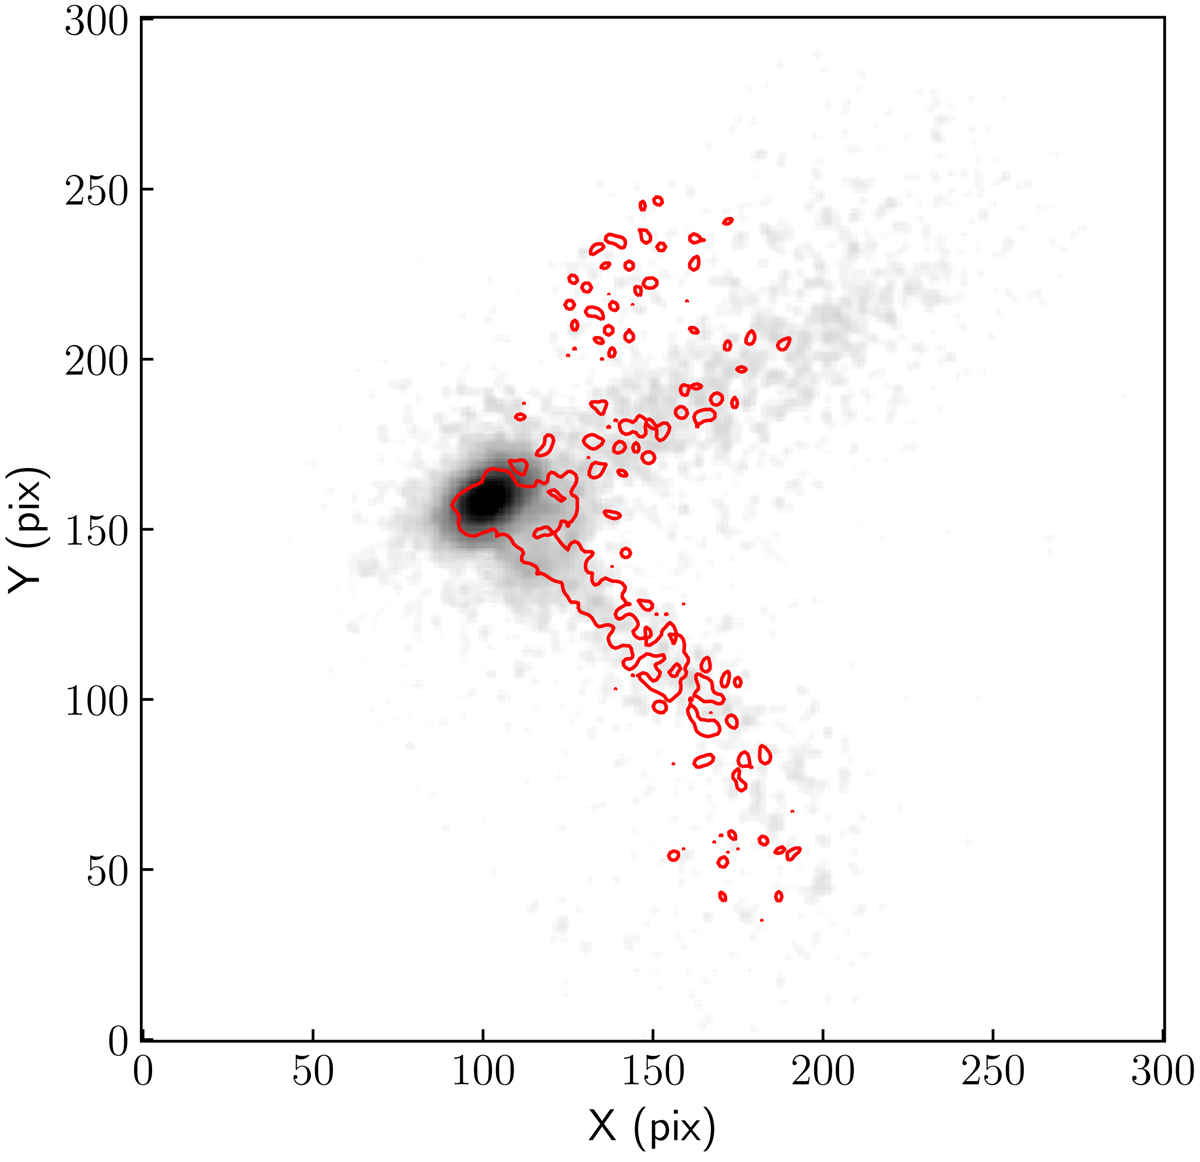
Snapshot of GalMer merger # 971 (Chilingarian et al. 2010) taken 2.5 Gyr after the start of the simulation and ∼2 Gyr after the first pericentral passage. The background greyscale image shows the distribution of stellar mass on a logarithmic scale. The red contours show the distribution of gas. Both stellar and gas images have been smoothed for clarity. The image is 750 × 750 kpc2, but note that we ignore the physical scale of the system in our comparison to NGC 1316 for reasons explained in the text.
Current usage metrics show cumulative count of Article Views (full-text article views including HTML views, PDF and ePub downloads, according to the available data) and Abstracts Views on Vision4Press platform.
Data correspond to usage on the plateform after 2015. The current usage metrics is available 48-96 hours after online publication and is updated daily on week days.
Initial download of the metrics may take a while.