Fig. 3.
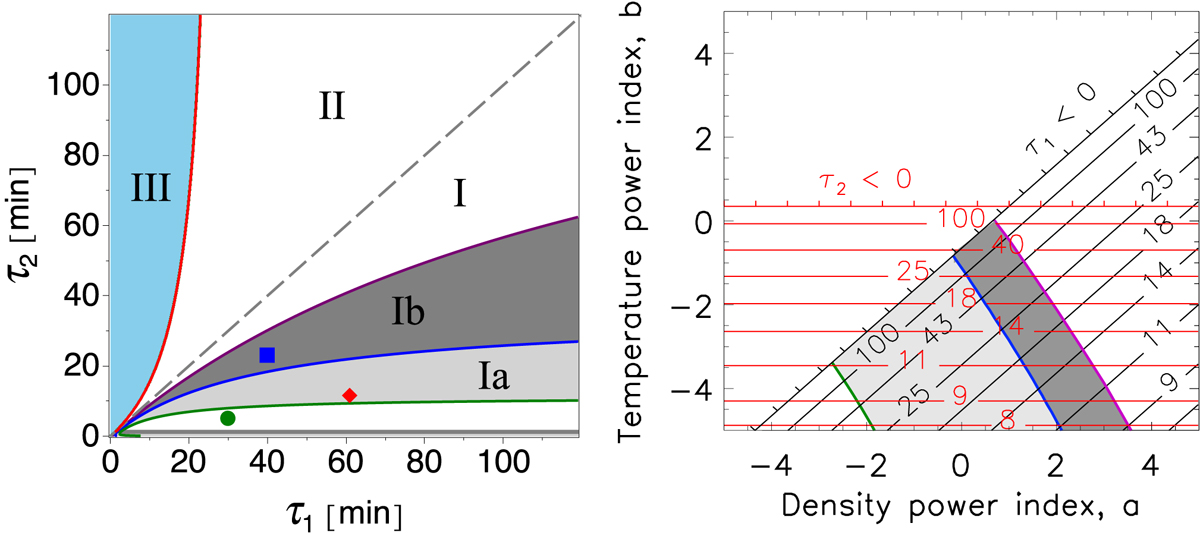
Left: parametric regions of the wave damping enhancement (I), suppression (II), and thermal over-stability (III). Grey-shaded regions indicate the values of τ1, 2 where the q-factor is in between 1 (the green line) and 2 (the blue line, Ia), and in between 2 and 3 (the purple line, Ib). The red, green, and blue symbols indicate some arbitrary values of τ1, 2 chosen for the numerical solutions shown in Fig. 4. Right: heating/cooling times τ1, 2 (see Eq. (6), black and red contours, respectively) determined for the CHIANTI radiative cooling, and the heating function in the form H(ρ, T) ∝ ρaTb for the varying temperature and density power indices a and b. The grey-shaded areas indicate the values of a and b where 1 < q-factor < 2 (light grey) and 2 < q-factor < 3 (dark grey). The green, blue, and purple lines show q-factor equals 1, 2, and 3, respectively.
Current usage metrics show cumulative count of Article Views (full-text article views including HTML views, PDF and ePub downloads, according to the available data) and Abstracts Views on Vision4Press platform.
Data correspond to usage on the plateform after 2015. The current usage metrics is available 48-96 hours after online publication and is updated daily on week days.
Initial download of the metrics may take a while.