| Issue |
A&A
Volume 628, August 2019
|
|
|---|---|---|
| Article Number | A55 | |
| Number of page(s) | 10 | |
| Section | Extragalactic astronomy | |
| DOI | https://doi.org/10.1051/0004-6361/201935897 | |
| Published online | 06 August 2019 | |
Peculiar motions of the gas at the centre of the barred galaxy UGC 4056
1
Main Astronomical Observatory, National Academy of Sciences of Ukraine, 27 Akademika Zabolotnoho St., 03680 Kyiv, Ukraine
e-mail: This email address is being protected from spambots. You need JavaScript enabled to view it.
2
Astronomisches Rechen-Institut, Zentrum für Astronomie der Universität Heidelberg, Mönchhofstr. 12-14, 69120 Heidelberg, Germany
3
University of Applied Sciences of Mittelhessen, Campus Friedberg, Department of Mathematics, Natural Sciences and Data Processing, Wilhelm-Leuschner-Straße 13, 61169 Friedberg, Germany
4
Kazan Federal University, 18 Kremlyovskaya St., 420008 Kazan, Russian Federation
5
Instituto de Astrofísica de Andalucía, CSIC, Apdo, 3004, 18080 Granada, Spain
6
The International Center of Future Science of the Jilin University, 2699 Qianjin St., 130012 Changchun City, PR China
7
Institut of Radio Astronomy of National Academy of Sciences of Ukraine, 4 Mystetstv Str., 61002 Kharkov, Ukraine
8
College of Physics, The Jilin University, 2699 Qianjin St., 130012 Changchun, PR China
Received:
12
May
2019
Accepted:
8
July
2019
Abstract
We derive the circular velocity curves of the gaseous and stellar discs of UGC 4056, a giant barred galaxy with an active galactic nucleus (AGN). We analyse UGC 4056 using the 2D spectroscopy obtained within the framework of the Mapping Nearby Galaxies at APO (MaNGA) survey. Using images and the colour index g − r from the Sloan Digital Sky Survey (SDSS), we determined the tilt of the galaxy, which allows us to conclude that the galaxy rotates clockwise with trailing spiral arms. We found that the gas motion at the central part of the UGC 4056 shows peculiar features. The rotation velocity of the gaseous disc shows a bump within around three kiloparsecs while the rotation velocity of the stellar disc falls smoothly to zero with decreasing galactocentric distance. We demonstrate that the peculiar radial velocities in the central part of the galaxy may be caused by the inflow of the gas towards the nucleus of the galaxy. The unusual motion of the gas takes place at the region with the AGN-like radiation and can be explained by the gas response to the bar potential.
Key words: galaxies: kinematics and dynamics / ISM: kinematics and dynamics / H II regions
© ESO 2019
1. Introduction
Optical and radio observations of nearby galaxies show evidence of both gas inflow towards the active galactic nuclei (AGNs; Knapen et al. 2000; Storchi-Bergmann et al. 2007; Riffel et al. 2008, 2013; Combes et al. 2014; Davies et al. 2014; Lena et al. 2015) and gas outflow from the AGNs (Storchi-Bergmann et al. 2007; Barbosa et al. 2009; Davies et al. 2014) on the scales of ∼10 − 100 pc. Gas inflow on these scales is frequently associated with nuclear bars and spiral arms. However, the impact of the gas inflow and outflow on the circum-nuclear region of galaxies and AGNs is still unclear.
A peculiar feature in the velocity field of the gaseous disc was revealed in the central part of UGC 4056, the only galaxy among more than 150 galaxies from the Mapping Nearby Galaxies at APO (MaNGA) survey for which circular velocity curves were derived (Pilyugin et al. 2019). This motivates us to consider this galaxy in detail and study the gas kinematics on scales of a few kiloparsecs around the AGN.
The galaxy UGC 4056 is a giant spiral galaxy of the morphological type SAB(s)c (de Vaucouleurs et al. 1991) and hosts an AGN. Two-dimensional spectroscopy of UGC 4056 was carried out within the MaNGA survey project, which is a part of the Sloan Digital Sky Survey (SDSS Collaboration 2017). The distributions of the surface brightness, the emission line fluxes, and the wavelengths of the emission and absorption lines (and consequently of the line-of-sight velocity field) across the image of this galaxy can be obtained from the MaNGA 2D spectroscopy. The moderate value of the inclination angle of the galaxy UGC 4056 (Fig. 1) facilitates the determination of the photometric (the surface brightness profile, colour profile), chemical (the radial abundance gradient), and kinematic (the circular velocity curve) properties from the analysis of the MaNGA 2D spectroscopy.
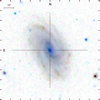 |
Fig. 1. Image of the galaxy UGC 4056 in the SDSS gri filters. |
The paper is structured as follows. The data are discussed in Sect. 2. In Sect. 5 we investigate the morphology of the detected peculiar motions using distributions of observed line-of-sight velocities of gas and stars along the major and minor axis of UGC 4056. The determination of the circular velocity curve, position angle (PA), and inclination of the target galaxy using a simple rotation model is presented in Sect. 6. An application of the Fourier analysis of the azimuthal distribution of the non-circular motions in thin ring zones at different galactocentric distances in the plane of the galaxy is presented in Sect. 7. Our results are summarised in Sect. 8.
2. Data
The giant spiral galaxy UGC 4056 is located at a redshift of z = 0.03203, and the corresponding distance is 133.3 Mpc (the NASA/IPAC Extragalactic Database, NED)1. The adopted distance was obtained by NED after applying a correction for infall towards the Virgo cluster, the Great Attractor, and the Shapley concentration with H0 = 73 km s−1 Mpc−1. With this distance, the spatial scale of the MaNGA data corresponds to 624 pc arcsec−1. According to de Vaucouleurs et al. (1991), the galaxy has the morphological type SAB(s)c. Baillard et al. (2011) confirm the presence of a bar, with a length of about one third of the isophotal diameter. Spiral arms and a weak bar are visible in Fig. 1. The bar extends up to a radius of ∼8 arcsec (which corresponds to 5 kpc in linear scale) from the centre of the galaxy roughly along the major axis of the disc. The spiral arms begin at the ends of the bar. However, the catalogue of visual morphological classification by Nair & Abraham (2010) based on SDSS images does not confirm the presence of a bar and assigned UGC 4056 the morphological type of T = 4 with an inner lens.
The stellar mass of the galaxy UGC 4056 is Ms = 1011.22 M⊙ according to the SDSS database (table STELLARMASSPCAWISCBC03). This value was obtained via the principal component analysis (PCA) method (Chen et al. 2012) using the library of model spectra by Bruzual & Charlot (2003). Meanwhile, Chang et al. (2015) obtained a stellar mass of Ms = 1010.93 M⊙ for this galaxy by fitting the spectral energy distribution to the combined SDSS and WISE photometry. The optical radius of UGC 4056 is R25 = 0.55 arcmin according to the RC3 catalogue (de Vaucouleurs et al. 1991) or R25 = 0.49 arcmin according to the HyperLeda2 database (Paturel et al. 2003; Makarov et al. 2014). Furthermore, the optical radius of UGC 4056 is R25 ≅ 21.26 kpc or R25 ≅ 18.95 kpc. We adopt here the mean value, R25 = 20 kpc. The 2D spectroscopy of UGC 4056 was carried out within the MaNGA survey project (its MaNGA datacube number is 8140-12703) (its MaNGA datacube number is 8140-12703; SDSS Collaboration 2017).
The publicly available data in MaNGA SDSS DR13 for the galaxy UGC 4056 form the basis of the current study. The analysis was carried out as in Zinchenko et al. (2016) and Pilyugin et al. (2018, 2019). Briefly, for each spaxel spectrum, the fluxes of the emission lines were measured. The velocity of each region (spaxel) is estimated from the measured wavelength of the Hβ and Hα emission lines and from the stellar absorption lines. The surface brightness in the SDSS g and r bands was obtained from broadband SDSS images created from the data cube. Those measurements were used for the determination of the photometric (surface brightness profile), the kinematic (inclination angle i, the PA of the major axis, and the circular velocity curve), and the chemical (the abundance map and the radial abundance gradient) properties of UGC 4056.
3. General properties of UGC 4056
The distributions of the surface brightness in the B band, the observed (line-of-sight) Hα velocity, and the oxygen abundance across the image of UGC 4056 are presented in Fig. 2. The surface brightness in the B band was obtained from the surface brightness in the SDSS g and r bands following the prescription described in Pilyugin et al. (2018).
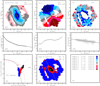 |
Fig. 2. Distributions of the B-band surface brightness (panel a1), the observed (line-of-sight) Hα velocity (panel b1), and the oxygen abundance (panel c1) across the image of the galaxy UGC 4056 in sky coordinates (pixels). Each characteristic is colour-coded as explained in panel f. The circles show the positions of the kinematic (yellow) and photometric (black) centre of the galaxy. The lines indicate the positions of the corresponding major axis of the galaxy. Panel a2: photometric profile constructed with kinematic angles (the inclination and the position of major axis; circles) and bulge-disc decomposition (line). Panels b2 and c2: rotation velocity and the oxygen abundance as a function of radius, respectively. Panel d: BPT diagram for individual spaxels. The solid (dark) and dashed (red) curves mark the demarcation line between AGNs and H II regions defined by Kauffmann et al. (2003) and Kewley et al. (2001), respectively. The dotted (blue) line is the dividing line between Seyfert galaxies and LINERs defined by Cid Fernandes et al. (2010). Panel e: distribution of spaxels with different types of radiation in the spaxel spectra (H II region-like – blue points, intermediate – red points, and AGN-like – black points) over the image of the galaxy. Panel f: explains the colour-coding of the values of the B-band surface brightness (in units of mag arcsec−2), the line-of-sight Hα velocity (in units of km s−1), and the oxygen abundance (in units of dex) used in panels a1, b1, c1. The pixel scale is 0.5 arcsec, the same as the size of the spaxels in the datacube. |
Panel a1 of Fig. 2 shows the surface brightness distribution in the B band across the image of UGC 4056 in sky coordinates (pixels). The geometric parameters of UGC 4056 (the coordinates of the centre X0 = 38.5 pixels and Y0 = 37.5 pixels, the inclination angle i = 64.2°, and the position angle of the major axis PA = 208.4°) were obtained in our current study from the analysis of the surface brightness map in the way described in Pilyugin et al. (2018). The formal error is 0.5 pixels for X0, Y0 and 1° for the inclination and PA. The black circle shows the photometric centre of the galaxy and the black line indicates the position of the major photometric axis of the galaxy. The yellow circle shows the kinematic centre of the galaxy and the yellow line indicates the position of its kinematic major axis, derived here following the method described in Pilyugin et al. (2018, also see detailed description in Sect. 6) of the current study.
Panel b1 of Fig. 2 shows the observed Hα velocity Vlos, Hα distribution across the image of the galaxy in sky coordinates (pixels). The value of the velocity is colour-coded with a step size of 35 km s−1; dark-blue corresponds to the minimum negative velocity, dark-red corresponds to the maximum positive velocity, and grey corresponds to zero line-of-sight velocity (see colour code explanation in panel f of Fig. 2). Despite the generally regular appearance of the velocity field, panel b1 shows an unusually high velocity feature in the inner part of the galaxy. Panel b2 shows the rotation velocity as a function of radius.
Panel c1 shows the oxygen abundance distribution across the image of UGC 4056 in sky coordinates (pixels). Panel c2 shows the radial distribution of the oxygen abundance. The abundances were estimated using the R calibration from Pilyugin & Grebel (2016). Since the R calibration can be applied only to H II regions, we used the [N II]λ6584/Hα versus [O III]λ5007/Hβ diagnostic diagram of Baldwin et al. (1981, the BPT diagram) to distinguish between H II region-like and AGN-like spectra (panel d of Fig. 2). The solid (dark) and dashed (red) curves in panel d of Fig. 2 mark the demarcation line between AGNs and H II regions defined by Kauffmann et al. (2003) and Kewley et al. (2001), respectively. The dotted (blue) line is the dividing line between Seyfert galaxies and a low-ionization nuclear emission-line regions (LINERs) defined by Cid Fernandes et al. (2010). If a point is located to the left of (below) the Kauffmann et al. demarcation line then this spectrum is classified as H II region-like spectrum (blue points). If the point is located right (above) of the Kewley et al. demarcation line then this spectrum is classified as an AGN-like spectrum (black points). If the point is located between the Kauffmann et al. and Kewley et al. demarcation lines then this spectrum is classified as intermediate (red points). Panel e shows the spatial distribution of zones with different types of radiation. The oxygen abundance was estimated only for the spaxels below the Kauffmann et al. demarcation line.
4. The sense of rotation
Thomasson et al. (1989) summarised three properties of an observed spiral galaxy that one needs to know in order to be able to decide whether its arms are leading or trailing: (i) The direction of the spiral pattern (if it is S-or Z-shaped), (ii) which side is approaching us, and (iii) which side is nearest to us. Our galaxy is Z-shaped in Fig. 1 with a blueshifted NE part and a redshifted SW part of the disc. Thus, we need to determine the tilt of the galaxy, that is which side is closer to us.
It is possible to find the closer part of the galaxy from the analysis of the colour index map of the galaxy assuming that the dust lane must be thinner than the stellar light distribution. In this case, the closer side of a galaxy should have higher extinction and therefore a higher colour index. Figure 3 shows the maps of the SDSS and MaNGA colour index g − r (right panels) as well as the magnitudes in the g and r SDSS bands (left and middle panels, respectively). The solid and dashed lines are the major and minor axis of the galaxy, respectively. As the maximum of the g − r colour index is clearly shifted to the right of the major axis, we conclude that the near side is to the right of the major axis. Based on our knowledge of the approaching and receding sides, the rotation of the galaxy occurs clockwise on the sky plane and the spiral arms are trailing arms as in most galaxies.
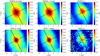 |
Fig. 3. Magnitudes in the g (left panels) and r (middle panels) bands and in the colour index g − r (right panels) from MaNGA and SDSS photometry in the inner part of UGC 4056. The solid and dashed lines indicate the major and minor axis of the galaxy, respectively. |
5. Morphology of peculiar motions in the central part of UGC 4056
In this section, we analyse the diagram “position vs. velocity” along the minor axis and the major axis, which allows us to detect the peculiar radial and tangential motions in the galaxy without restrictions imposed by any kinematic model. For this purpose, we used our measurements of the position angle, inclination, and coordinates of the centre of the galaxy obtained from galaxy photometry in Sect. 3.
5.1. Line-of-sight velocities along the major axis
The velocity of each region (spaxel) is estimated from the measured wavelength of the Hβ and Hα emission line and from the stellar absorption lines, corrected for the redshift z = 0.032104, which corresponds to a radial velocity of V = 9625 km s−1. If the correction for the systemic radial velocity is right, then the measured line-of-sight velocities along the approaching side of the major axis must coincide with the ones along the receding side. Figure 4 compares the approaching (blue curve) with the receding (red curve) sides of the position–velocity diagram. The curves of the approaching and the receding circular velocities generally coincide, which confirms the estimated systemic radial velocity of the galaxy as well as the estimated coordinates of the centre of the galaxy.
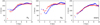 |
Fig. 4. Comparison of the approaching (blue circles) and the receding (red plus symbols) sides of the position–velocity diagram along the major axis. |
We now consider some features of the radial distribution of the measured velocities along the major axis. In the nuclear region (R < 2 kpc) the velocities of the ionized gas show a prominent “bump”, while the velocities of stars increase more smoothly with radius. The high-velocity gas detected along the major axis in the central region can be explained as an impact of the bar. The bisymmetric model of the bar by Spekkens & Sellwood (2007) implies tangential and radial components of the non-circular motion caused by the bar, which can explain the streaming motions along both the major and minor axes. However, it should be noted that UGC 4056 has a weak bar and no such high-velocity gas streaming motions were found in the two barred galaxies from the sample of Sakhibov et al. (2018).
We next consider the interval 2 kpc < R < 4 kpc. Here the curves of the approaching and the receding velocities measured from the Hα line (Fig. 4, left panel) oscillate relative to each other along the major axis with an amplitude < 10 km s−1. Such oscillations can indicate peculiar velocities of gas with an amplitude ≈10 km s−1 caused by a symmetric second mode (two-armed spiral) of a spiral density wave in the galaxy disc. On the other hand, in the case of measurements from the Hβ line (Fig. 4, middle panel) the receding velocity exceeds the approaching velocity in the entire interval from 2 kpc up to 4 kpc by ≈20 km s−1. At galactocentric distances of R > 4 kpc the curves of the approaching and the receding velocities measured from the Hβ line (Fig. 4, middle panel) oscillate relative to each other in a similar fashion as in the case of the Hα line. Curves of the approaching and receding velocities of stars (Fig. 4, right panel) do not show noticeable deviations from each other. The impact of spiral arms can be hidden because of the larger radial velocity dispersion of the stars.
Figure 5 (left panel) shows the distribution of the measured line-of-sight velocities Vlos of ionized gas (Hα -red crosses, Hβ -green squares) along the major axis in the approaching and receding sides of the galaxy. We note that the observed line-of-sight velocities are not corrected for the galaxy inclination. The gas “velocity bump” takes place in the central region (R < 2 kpc) of the disc. The distribution of the measured stellar line-of-sight velocities Vlos (blue triangles) shows no peculiarity (no bump) in the central region (R < 2 kpc) of the disc. There is a systematic deviation between the circular velocity of the gas and circular velocity of stars in the area 4−10 kpc. The stellar disc rotates approximately 10−25 km s−1 more slowly than the gas disc. The slower rotation of the stars compared to the gas in the disc may be caused by the asymmetric drift (Binney & Tremaine 2008; Sysoliatina et al. 2018).
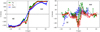 |
Fig. 5. Left panel: distribution of the measured Hα (red crosses), Hβ (green squares), and stellar (blue triangles) line-of-sight velocities Vlos along the major axis over the sky plane. Right panel: distribution of the measured Hα (red crosses), Hβ (green squares), and stellar (blue triangles) line-of-sight velocities Vlos along the minor axis over the sky plane. The measured points do not lie further than 0.32 kpc (< 1 spaxel or < 0.5 arcsec) from the axes. |
5.2. Line-of-sight velocities along the minor axes
Because the points located on the minor axis of the galaxy do not contribute to the measured rotation velocity, but only to the radial component, it is interesting to examine the existence of any radial motion along the minor axis. This statement is valid if the disc is relatively thin. The line-of-sight velocities of stars (blue triangles) in the inner part of the minor axis (R < 5 kpc) show a negligible radial component, which is approximately equal to the observational error. In contrast, the gas shows a noticeable radial velocity in the inner (R < 2 kpc) part of the minor axis (crosses and squares). We plot only spaxels in which the flux signal-to-noise ratio is ≥6. We note that the observed velocities Vlos are not corrected for the galaxy inclination. A correction for the galaxy inclination increases the radial velocities up to ≈60 km s−1. There are prominent radial velocities of stars at the south-east end of the minor axis. The perturbation of the velocity field of stars at R > 9 kpc is noticeable also when one compares velocities of the approaching and receding sides of the disc (Fig. 4, right).
A negative radial velocity, measured in the distant part of the minor axis (SE part), and a positive radial velocity, measured in the closer part of the minor axis (NW part); see right panel of Fig. 5), indicates a significant inflow of ionized gas toward the central region (R < 3 kpc) of the galaxy.
6. Circular velocity curves of UGC 4056
The main question is whether the velocity bump on the line-of-sight velocity curve (along the major axis in Fig. 5) displays a faster rotation of the ionized gas than the rotation of stars, or whether it is only a contribution to the line-of-sight line of the radial motion of the gas. Below, we analyse 2D velocity maps of all our three tracers with models. The model considered in the present section considers simultaneously contributions of the tangential and radial components in the observed velocity (Eq. (1)). The model is able to separate the tangential and radial components of the observed velocity in every spaxel. In Sect. 7 we complement this model with terms that consider the impact of peculiar velocities caused by spiral arms.
6.1. Determination of circular velocity curve
The determination of the rotation velocity from the observed velocity field is performed in the standard way (e.g. Warner et al. 1973; Begeman 1989; de Blok et al. 2008; Oh et al. 2018). The observed line-of-sight velocities Vlos recorded on a set of sky coordinates (x, y) are related to the kinematic parameters by:
 (1)
(1)
Here,
 (2)
(2)
 (3)
(3)
where R is the radius of a ring in the plane of the galaxy:
![Mathematical equation: $$ \begin{aligned} R =&\bigg [ \bigg \{ - (x-x_0) \sin (\mathrm{PA}) + (y-y_0) \cos (\mathrm{PA}) \bigg \}^{2} \nonumber \\& + \bigg \{\left[(x-x_0) \cos (\mathrm{PA}) + (y-y_0) \sin (\mathrm{PA})\right]/\cos i \bigg \} ^{2}\bigg ]^{1/2}, \end{aligned} $$](/articles/aa/full_html/2019/08/aa35897-19/aa35897-19-eq4.gif) (4)
(4)
where x0 and y0 are the sky coordinates of the rotation centre of the galaxy, Vsys is the systemic velocity, Vrot is the circular velocity at the distance R from the centre, Vrad is the radial velocity at the distance R from the centre, PA is the position angle of the major axis, and i is the inclination angle.
The deprojected galaxy plane is divided into rings of a width of one pixel. The rotation velocity and the radial velocity are assumed to be the same for all the points within the ring. The position angle of the major axis and galaxy inclination angle are assumed to be the same for all the rings, that is, constant within the disc. The parameters x0, y0, Vsys, PA, i, and the circular velocity curve Vrot(R) were derived through the best fit to the observed velocity field Vlos(x, y), that is, we require that the mean deviation σVlos given by
![Mathematical equation: $$ \begin{aligned} \sigma _{V_{\rm los}} = \sqrt{\bigg [\sum \limits _{j=1}^n \bigg (V_{\mathrm{los},j}^\mathrm{cal} - V_{\mathrm{los},j}^\mathrm{obs}\bigg )^{2}\bigg ]{\bigg /}n} \end{aligned} $$](/articles/aa/full_html/2019/08/aa35897-19/aa35897-19-eq5.gif) (5)
(5)
is minimized. Here, the  is the measured line-of-sight velocity of the jth spaxel and
  is the velocity computed through Eq. (1) for the corresponding sky coordinates x and y.
6.2. Circular velocity curve of UGC 4056
Three values of the line-of-sight velocity of each region (spaxel) are estimated from the measured wavelengths of the Hα and Hβ emission lines and from the stellar spectra. The values of the Hα, Hβ, and stellar line-of-sight velocities were measured in the spectra of around 2800 regions (spaxels) on the image of UGC 4056.
Firstly, we derive the circular velocity curves using all the observed velocity values Vlos and neglecting a possible radial motion, that is, we assume that the term Vrad in Eq. (1) is equal to zero at any galactocentric distance. The circular velocity curves based on the observed Hα velocities Vlos, Hα, the observed Hβ velocities Vlos, Hβ, and the observed star velocities Vlos, star are referred to as cases AR, BR, and SR, respectively. The geometric parameters of UGC 4056 obtained in those cases are reported in Table 1. The derived circular velocity curves are shown in panel a of Fig. 6 by open circles (case AR), plus symbols (case BR), and crosses (case SR).
Conditions under which the different variants of the circular velocity curve are derived.
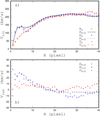 |
Fig. 6. Circular velocity curves derived using all the spaxels with measured velocities (panel a). The circular velocity curve based on the Hα velocities is shown by the open circles (case AR, the radial motion is neglected) and by the solid line (case AR + E, the radial motion is included). The circular velocity curve based on the Hβ velocities is denoted by the plus symbols (case BR, without the radial motion) and by the dotted line (case BR + E, with the radial motion). The circular velocity curve based on the stellar velocities is presented by the crosses (case SR, without the radial motion) and by the dashed line (case SR + E, with the radial motion). Panel b: radial velocity as a function of radius for the cases AR + E (open circles), BR + E (plus signs), and SR + E (crosses). The geometric parameters and other characteristics of each case are reported in Table 1. |
Examination of panel a of Fig. 6 shows that the AR circular velocity curve shows a hump at galactocentric distances between R ∼ 3 and R ∼ 10 pixels. The BR circular velocity curve is close to the AR curve and also shows a hump in this interval of galactocentric distances. In contrast to this, the rotation velocity of the stellar disc (the SR circular velocity curve) falls more or less smooth to zero with decreasing galactocentric distance in this interval. This suggests that the gas motion differs from the star motion in the central region of the galaxy UGC 4056.
It is evident that the uncertainties in the measured Vlos, Hα, Vlos, Hβ, and Vlos, star velocities could distort the corresponding circular velocity curves. It was noted in Pilyugin et al. (2019) that the velocity map obtained from the Hα emission line measurements is preferable to derive the circular velocity curve of the gaseous disc. Indeed, the stronger line Hα is usually measured with higher precision than the weaker Hβ line. One can therefore expect that the error in the measured wavelength of the Hα emission line e(λ0) is lower than that for the Hβ emission line. Moreover, the error in the measured wavelength of the Hα line results in a lower error of the velocity e(λ0)/λ0 than the similar error in the measured wavelength of the Hβ line. Further, the error in the rotation velocity of the point (spaxel) e(Vrot) depends not only on the error in the line-of-sight velocity e(Vlos) but also on the position of the region (spaxel) in the galaxy (angle θ). Those errors are related by the expression e(Vrot) = e(Vlos)/(cosθ sin i) – see Eq. (1) –, that is, for a given error in the Vlos the error in the Vrot is minimum in the spaxels near the major axis of the galaxy and is maximum in the spaxels along the minor axis. The MaNGA integral field unit covers only part of the galaxy UGC 4056.
As the next step, we derive the circular velocity curves taking into account the possible radial motion. The circular velocity curves based on Vlos, Hα, Vlos, Hβ, and Vlos, star are referred to here as cases AR + E, BR + E, and SR + E. The derived circular velocity curves are shown in panel a of Fig. 6 by a solid line (case AR + E), by a dotted line (case BR + E), and by a dashed line (case SR + E). The geometric parameters of the galaxy obtained in those cases are reported in Table 1. Inspection of panels a and c of Fig. 6 reveals a good agreement between the rotation velocities obtained with and without taking into account the radial motion.
Panel b of Fig. 6 shows the radial velocity as a function of radius for the cases AR + E (filled circles), BR + E (plus signs), and SR + E (crosses). The disagreement between the values of the radial velocity at a given galactocentric distance obtained for the Hα and Hβ velocities can be as large as ∼10 km s. This value can be adopted as the uncertainty in the Vrad determinations. Panels b and d of Fig. 6 show that the gas radial velocities Vrad at the central region can reach 30−40 km s−1, that is they exceed the adopted uncertainty in the Vrad determinations. The radial velocities of the stellar disc do not exceed the adopted uncertainty in the Vrad at the central region. Thus, there is evidence in favour of the radial motion of the gaseous disc near the centre.
7. Fourier analysis of the azimuthal distribution of the non-circular motions in thin ring zones
The model used in Sect. 6 detects circular and axisymmetric radial motions. Moreover, the model provides the orientation parameters and the kinematical centre of the galaxy disc presented in Table 1. In the current section, we investigate the impact of peculiar velocities caused by spiral density waves using Fourier analysis for the azimuthal distribution of the measured line-of-sight velocities in thin ring zones for a set of galactocentric distances.
7.1. Model
As we discussed in our previous paper (Sakhibov et al. 2018), the line-of-sight velocity  observed at a given point of the disc involves the velocity of the galaxy as a whole, Vgal, the rotation velocity Vrot(R), a pure radial inflow or outflow VR, and the peculiar velocities caused by the density wave perturbation.
We approximate the measured line-of-sight velocity  at a given point (R, θ) of the disc, using a similar approach as in Sakhibov et al. (2018):
 (6)
(6)
where the coefficients a0, a1, b1, a2, b2, a3, and b3 are
 (7)
(7)
Here, R and θ are polar coordinates of a point on the plane of the disc, the quantities  ,
,  , μ1, and R01 refer to the velocity perturbation amplitudes, the pitch angle, and scaling factor for the first mode (m = 1), and
  ,
,  , μ2, and R02 stand for the velocity perturbation amplitudes, the pitch angle, and the scaling factor for the second mode (m = 2) of a spiral density wave, respectively.
Equations (6) and (7) describe a model that takes into account not only the main rotation of the disc and radial symmetric motion, but also the impact of the first and second modes of the spiral density wave in the disc. A more detailed description and references were presented in Sakhibov et al. (2018).
7.2. Radial course of the Fourier harmonicas containing rotation and the radial motion
We carried out a Fourier analysis of the velocity maps derived from the measured wavelength of the Hα emission line and from the stellar absorption lines.
The black line in Fig. 7 shows a radial course of the Fourier coefficients a1(R) computed from the Hα, Hβ, and stellar velocity maps. As shown in Eq. (7), the first Fourier coefficient a1 includes contributions from the circular velocity Vθ and from the second mode of the spiral density wave. Since the amplitude of the velocity perturbation from the spiral arms is about 5−10 km s−1 and has the same magnitude as the accuracy of the circular velocity curve determined in Sect. 6 these two curves must coincide. We compare the radial trend of the Fourier coefficient a1 with the rotation velocity computed in Sect. 6 (Fig. 6, panel c) from Eq. (1) (green line). In general, the black and green curves coincide everywhere, except for the central area of the disc (for gas) and the external border of the measured area of the disc. The deviations between the two curves in these areas however are within the error interval. Moreover, both curves show a “bump” at R ≈ 1 kpc in the case of ionized gas and a smooth course in the case of stars. The blue stars and red crosses show the observations, the blue stars show approaching line-of-sight velocities observed along the major axis and corrected for inclination, and the red crosses show the receding ones.
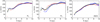 |
Fig. 7. Radial change of the Fourier coefficients a1 (black line) computed from the Hα, Hβ, and stellar component velocity maps. The green curve shows the rotation velocity computed in Sect. 6. Blue circles and red plus signs show the rotation velocity along the approaching and the receding sides of the major axis corrected for the inclination of the galaxy. |
Figure 8 shows a radial course of the Fourier coefficients b1(R) (black line) computed from the Hα, Hβ, and stellar velocity maps. We compare the radial change of the Fourier coefficient b1 with the curve of radial velocity computed in Sect. 6 (Fig. 6, panel d) from Eq. (1) (green line). According to Eq. (7) the coefficient b1 contains the radially symmetric velocity VR and perturbations from the spiral arms. There is a difference between radial velocities of gas and stars in the central region of the disc (R < 3 kpc). One can see that the ionized gas shows prominent radial motion up to ≈25 km s−1 at a galactocentric distance of R ≈ 2 kpc, while the stars show radial velocities VR < 10 km s−1. This corresponds to the absence of a bump on the circular velocity curve of stars and relatively small line-of-sight velocities of stars observed in the central part of the minor axis (Fig. 5, right panel, blue line).
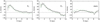 |
Fig. 8. Radial change of the Fourier coefficients b1 (black line) computed from the Hα, Hβ, and stellar component velocity maps. The green dashed curve shows the radial velocity computed in Sect. 6. The black dashed line marks no radial motion. |
Such gas motions at R ≈ 2 − 4 kpc can be explained by the gas response to the bar potential. Inside the co-rotation radius of the bar the gas may be accelerated along the leading edges of the bar. However, in the region R < 1 kpc the bar potential should be close to axisymmetric, which could lead to various scenarios of inflow ranging from axisymmetric radial inflow to local streams of gas formed in the outer region of the bar. As the spatial resolution of our data for UGC 4056 is ∼1 kpc, observations with the higher spatial resolution are needed to study the kinematics of the nuclear region in detail.
7.3. Perturbations of the velocity field from spiral arms
An impact of the spiral arms can be inferred through the radial change of the Fourier coefficients a3 and b3 presented in Fig. 9. As shown in Eq. (7), the third Fourier harmonic (coefficients a3 and b3) includes a contribution only from the second mode of the spiral density wave. One can see that the velocity perturbations of the second mode of the spiral density wave change from about −5 to +5 km s−1, which corresponds to a small-amplitude perturbation of the galactic gravitational potential (≈5%). Figure 9 shows that the periodic change of the third harmonic can be well approximated in the interval 2.5−7.5 kpc with a two-armed (m = 2) spiral pattern with the following geometrical parameters: pitch angle μ2 ≈ 24° and R02 ≈ 4 kpc. We adopt a logarithmic form for the spiral arms
 (8)
(8)
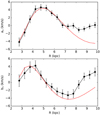 |
Fig. 9. Radial change of the third harmonics a3 and b3 compared with a two-armed spiral pattern with pitch angle μ2 = 24° and R02 = 4 kpc (red line). Filled circles show the derived values of the third harmonic. The red curves are a model for a two-armed spiral. |
where R and θ are polar coordinates in the plane of the galaxy and μ is a pitch angle of the spiral arm.
As shown in Sakhibov et al. (2018), the geometrical parameters of two-armed spirals μ2 and R02 can be found from the radial change of the Fourier coefficients a3 and b3, using a linear regression
 (9)
(9)
with the notations
The estimation of the coefficients of the regression (9) provides the geometrical parameters of two-armed spirals, μ2 = 24 ° ±2° and R02 = 4 ± 0.5 kpc. The same approach applied to the Fourier coefficients a2(R) and b2(R) provides the geometrical parameters of a one-armed spiral (mode m = 1), μ1 = 13 ° ±1° and R01 = 3 ± 0.5 kpc.
As the systemic velocity of the galaxy was subtracted before the calculation of the Fourier coefficients, the radial course of a zero harmonic a0(R) corresponds to a radial change of the velocity perturbations from the first mode of a density wave. Figure 10 shows that the periodic change of the zero harmonic a0(R) can be well approximated with a one-armed (m = 1) spiral pattern with the following geometrical parameters: pitch angle μ1 = 12.6° and R01 = 2.6 kpc, which conform to the μ1 and R01 obtained using the radial distribution of the a2 and b2 Fourier coefficients.
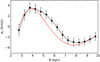 |
Fig. 10. Radial change of the zero harmonic a0 compared with a model of the first mode of a spiral density wave with the pitch angle μ1 = 12.6° and R01 = 2.6 kpc (red line). |
8. Summary
Using data from the MaNGA survey (datacube 8140-12703), we study the velocity field of the gas and stellar component in the giant spiral galaxy UGC 4056 which hosts an AGN. Using maps of the colour index g − r obtained using SDSS and MaNGA images we determined the tilt of the galaxy, which allows us to conclude that the galaxy rotates clockwise with trailing spiral arms.
We find a radial motion of gas in the central part of UGC 4056. As shown in Sect. 5, the radial motion of the ionized gas in the central part of the galaxy can produce an impact on the observed line-of-sight velocity curve (Figs. 4 and 5, left). Such an observational effect can be detected as a “velocity bump” on the central part of the circular velocity curve. We demonstrate that the radial velocities detected in the central part of the galaxy can be caused by the inflow of the gas towards the nucleus of the galaxy. This gas inflow can be explained by the response of the gas to the bar potential in the inner part of the galaxy. This scenario supports the hypothesis that a bar could transport gas towards the inner kiloparsec (Crenshaw et al. 2003).
Along with a radial motion of gas in the central part of the galaxy, there is a gravitational spiral density wave that creates a field of peculiar velocities with an amplitude of about 5 km s−1 and that can be described by a logarithmic two-armed spiral with a pitch angle μ ≈ 24°. The pitch angle of ≈24° corresponds to the late morphological type of UGC 4056.
Observations with high spatial resolution are needed to identify the detailed structure and the cause of the peculiar velocity field in the central part of UGC 4056.
The NASA/IPAC Extragalactic Database (NED) is operated by the Jet Propulsion Laboratory, California Institute of Technology, under contract with the National Aeronautics and Space Administration. http://ned.ipac.caltech.edu/
Acknowledgments
We are grateful to the referee for his/her constructive comments. I.A.Z. thanks the Max Planck Institute for Astrophysics for funding through its visitor’s program. L.S.P., E.K.G., and I.A.Z. acknowledge support within the framework of Sonderforschungsbereich (SFB 881) on “The Milky Way System” (especially subproject A5), which is funded by the German Research Foundation (DFG). L.S.P. and I.A.Z. thank for the hospitality of the Astronomisches Rechen-Institut at Heidelberg University, where part of this investigation was carried out. I.A.Z. acknowledges the support of the National Academy of Sciences of Ukraine by the grant 417Kt and the support of the Volkswagen Foundation under the Trilateral Partnerships grant No. 90411. P.B. acknowledges the support of the Volkswagen Foundation under the Trilateral Partnerships grant 90411 and the support by the National Astronomical Observatories of Chinese Academy of Science (NAOC/CAS) through the Silk Road Project, through the Thousand Talents (Qianren) program and the Presidents International Fellowship for Visiting Scientists and the National Science Foundation of China under grant No. 11673032. This work benefited from support by the International Space Science Institute, Bern, Switzerland, through its International Team program ref. no. 393 “The Evolution of Rich Stellar Populations & BH Binaries” (2017-18). P.B. acknowledges the special support by the NASU under the Main Astronomical Observatory GRID/GPU computing cluster project. This work was partly funded by the subsidy allocated to Kazan Federal University for the state assignment in the sphere of scientific activities (L.S.P.). J.M.V. acknowledges support from the State Agency for Research of the Spanish MCIU through the “Center of Excellence Severo Ochoa” award for the Instituto de Astrofísica de Andalucía (SEV-2017-0709), and from grant AYA2016-79724-C4-4-P cofunded by FEDER. We acknowledge the usage of the HyperLeda database (http://leda.univ-lyon1.fr). Funding for the Sloan Digital Sky Survey IV has been provided by the Alfred P. Sloan Foundation, the US Department of Energy Office of Science, and the Participating Institutions. SDSS-IV acknowledges support and resources from the Center for High-Performance Computing at the University of Utah. The SDSS web site is www.sdss.org. SDSS-IV is managed by the Astrophysical Research Consortium for the Participating Institutions of the SDSS Collaboration including the Brazilian Participation Group, the Carnegie Institution for Science, Carnegie Mellon University, the Chilean Participation Group, the French Participation Group, Harvard-Smithsonian Center for Astrophysics, Instituto de Astrofísica de Canarias, The Johns Hopkins University, Kavli Institute for the Physics and Mathematics of the Universe (IPMU)/University of Tokyo, Lawrence Berkeley National Laboratory, Leibniz Institut für Astrophysik Potsdam (AIP), Max-Planck-Institut für Astronomie (MPIA Heidelberg), Max-Planck-Institut für Astrophysik (MPA Garching), Max-Planck-Institut für Extraterrestrische Physik (MPE), National Astronomical Observatories of China, New Mexico State University, New York University, University of Notre Dame, Observatário Nacional/MCTI, The Ohio State University, Pennsylvania State University, Shanghai Astronomical Observatory, United Kingdom Participation Group, Universidad Nacional Autónoma de México, University of Arizona, University of Colorado Boulder, University of Oxford, University of Portsmouth, University of Utah, University of Virginia, University of Washington, University of Wisconsin, Vanderbilt University, and Yale University.
References
- Baillard, A., Bertin, E., de Lapparent, V., et al. 2011, A&A, 532, A74 [NASA ADS] [CrossRef] [EDP Sciences] [Google Scholar]
- Baldwin, J. A., Phillips, M. M., & Terlevich, R. 1981, PASP, 93, 5 [NASA ADS] [CrossRef] [EDP Sciences] [Google Scholar]
- Barbosa, F. K. B., Storchi-Bergman, T., Cid Fernandes, R., Winge, C., & Schmitt, H. 2009, MNRAS, 396, 2 [NASA ADS] [CrossRef] [Google Scholar]
- Begeman, K. G. 1989, A&A, 223, 47 [NASA ADS] [Google Scholar]
- Binney, J., & Tremaine, S. 2008, Galactic Dynamics: Second Edition (Princeton University Press) [Google Scholar]
- Bruzual, G., & Charlot, S. 2003, MNRAS, 344, 1000 [NASA ADS] [CrossRef] [Google Scholar]
- Chang, Y.-Y., van der Wel, A., da Cunha, E., & Rix, H.-W. 2015, ApJS, 219, 8 [NASA ADS] [CrossRef] [Google Scholar]
- Chen, Y.-M., Kauffmann, G., Tremonti, C. A., et al. 2012, MNRAS, 421, 314 [NASA ADS] [Google Scholar]
- Cid Fernandes, R., Stasińska, G., Schlickmann, M. S., et al. 2010, MNRAS, 403, 1036 [NASA ADS] [CrossRef] [Google Scholar]
- Combes, F., Garcia-Buritto, S., Casasola, V., et al. 2014, A&A, 565, A97 [NASA ADS] [CrossRef] [EDP Sciences] [Google Scholar]
- Crenshaw, D. M., Kraemer, S. B., & Gabel, J. R. 2003, AJ, 126, 1690 [NASA ADS] [CrossRef] [Google Scholar]
- Davies, R. I., Maciejewski, W., Hicks, E. K. S., et al. 2014, ApJ, 792, 101 [NASA ADS] [CrossRef] [Google Scholar]
- de Blok, W. J. G., Walter, F., Brinks, E., et al. 2008, AJ, 136, 2648 [NASA ADS] [CrossRef] [Google Scholar]
- de Vaucouleurs, G., de Vaucouleurs, A., Corvin, H. G., et al. 1991, Third Reference Catalog of Bright Galaxies (New York: Springer Verlag RC3) [Google Scholar]
- Kauffmann, G., Heckman, T. M., Tremonti, C., et al. 2003, MNRAS, 346, 1055 [Google Scholar]
- Kewley, L. J., Dopita, M. A., Sutherland, R. S., Heisler, C. A., & Trevena, J. 2001, ApJ, 556, 121 [Google Scholar]
- Knapen, J. H., Shlosman, I., Heller, C. H., et al. 2000, ApJ, 528, 219 [NASA ADS] [CrossRef] [Google Scholar]
- Lena, D., Robinson, A., Storchi-Bergman, T., et al. 2015, ApJ, 806, 84 [Google Scholar]
- Makarov, D., Prugniel, P., Terekhova, N., Courtois, H., & Vauglin, I. 2014, A&A, 570, A13 [CrossRef] [EDP Sciences] [Google Scholar]
- Nair, P. B., & Abraham, R. G. 2010, ApJS, 186, 427 [NASA ADS] [CrossRef] [Google Scholar]
- Oh, S.-H., Staveley-Smith, L., Spekkens, K., Kamphuis, P., & Koribalski, B. S. 2018, MNRAS, 473, 3256 [NASA ADS] [CrossRef] [Google Scholar]
- Paturel, G., Petit, C., Prugniel, P., et al. 2003, A&A, 412, 45 [NASA ADS] [CrossRef] [EDP Sciences] [Google Scholar]
- Pilyugin, L. S., & Grebel, E. K. 2016, MNRAS, 457, 3678 [NASA ADS] [CrossRef] [Google Scholar]
- Pilyugin, L. S., Grebel, E. K., Zinchenko, I. A., et al. 2018, A&A, 613, A1 [NASA ADS] [CrossRef] [EDP Sciences] [Google Scholar]
- Pilyugin, L. S., Grebel, E. K., Zinchenko, I. A., Nefedyev, Y. A., & Vílchez, J. M. 2019, A&A, 623, A122 [NASA ADS] [CrossRef] [EDP Sciences] [Google Scholar]
- Riffel, R. A., Storchi-Bergmann, T., Wings, C., et al. 2008, MNRAS, 385, 1129 [NASA ADS] [CrossRef] [Google Scholar]
- Riffel, R. A., Storchi-Bergmann, T., & Wings, C. 2013, MNRAS, 430, 2259 [Google Scholar]
- Sakhibov, F., Zinchenko, I. A., Pilyugin, L. S., et al. 2018, MNRAS, 474, 1657S [NASA ADS] [CrossRef] [Google Scholar]
- SDSS Collaboration (Albareti, F. D., et al.) 2017, ApJS, 233, 25 [NASA ADS] [CrossRef] [Google Scholar]
- Spekkens, K., & Sellwood, J. A. 2007, ApJ, 664, 204 [NASA ADS] [CrossRef] [Google Scholar]
- Storchi-Bergmann, T., Dors, Jr., O. L., Riffel, R. A., et al. 2007, ApJ, 670, 959 [NASA ADS] [CrossRef] [Google Scholar]
- Sysoliatina, K., Just, A., Golubov, O., et al. 2018, A&A, 614, A63 [Google Scholar]
- Thomasson, M., Donner, K. J., Sundelius, B., et al. 1989, A&A, 211, 25 [NASA ADS] [Google Scholar]
- Warner, P. J., Wright, M. C. H., & Baldwin, J. E. 1973, MNRAS, 163, 163 [NASA ADS] [Google Scholar]
- Zinchenko, I. A., Pilyugin, L. S., Grebel, E. K., Sánchez, S. F., & Vílchez, J. M. 2016, MNRAS, 462, 2715 [NASA ADS] [CrossRef] [Google Scholar]
All Tables
Conditions under which the different variants of the circular velocity curve are derived.
All Figures
|
Fig. 1. Image of the galaxy UGC 4056 in the SDSS gri filters. |
| In the text | |
|
Fig. 2. Distributions of the B-band surface brightness (panel a1), the observed (line-of-sight) Hα velocity (panel b1), and the oxygen abundance (panel c1) across the image of the galaxy UGC 4056 in sky coordinates (pixels). Each characteristic is colour-coded as explained in panel f. The circles show the positions of the kinematic (yellow) and photometric (black) centre of the galaxy. The lines indicate the positions of the corresponding major axis of the galaxy. Panel a2: photometric profile constructed with kinematic angles (the inclination and the position of major axis; circles) and bulge-disc decomposition (line). Panels b2 and c2: rotation velocity and the oxygen abundance as a function of radius, respectively. Panel d: BPT diagram for individual spaxels. The solid (dark) and dashed (red) curves mark the demarcation line between AGNs and H II regions defined by Kauffmann et al. (2003) and Kewley et al. (2001), respectively. The dotted (blue) line is the dividing line between Seyfert galaxies and LINERs defined by Cid Fernandes et al. (2010). Panel e: distribution of spaxels with different types of radiation in the spaxel spectra (H II region-like – blue points, intermediate – red points, and AGN-like – black points) over the image of the galaxy. Panel f: explains the colour-coding of the values of the B-band surface brightness (in units of mag arcsec−2), the line-of-sight Hα velocity (in units of km s−1), and the oxygen abundance (in units of dex) used in panels a1, b1, c1. The pixel scale is 0.5 arcsec, the same as the size of the spaxels in the datacube. |
| In the text | |
|
Fig. 3. Magnitudes in the g (left panels) and r (middle panels) bands and in the colour index g − r (right panels) from MaNGA and SDSS photometry in the inner part of UGC 4056. The solid and dashed lines indicate the major and minor axis of the galaxy, respectively. |
| In the text | |
|
Fig. 4. Comparison of the approaching (blue circles) and the receding (red plus symbols) sides of the position–velocity diagram along the major axis. |
| In the text | |
|
Fig. 5. Left panel: distribution of the measured Hα (red crosses), Hβ (green squares), and stellar (blue triangles) line-of-sight velocities Vlos along the major axis over the sky plane. Right panel: distribution of the measured Hα (red crosses), Hβ (green squares), and stellar (blue triangles) line-of-sight velocities Vlos along the minor axis over the sky plane. The measured points do not lie further than 0.32 kpc (< 1 spaxel or < 0.5 arcsec) from the axes. |
| In the text | |
|
Fig. 6. Circular velocity curves derived using all the spaxels with measured velocities (panel a). The circular velocity curve based on the Hα velocities is shown by the open circles (case AR, the radial motion is neglected) and by the solid line (case AR + E, the radial motion is included). The circular velocity curve based on the Hβ velocities is denoted by the plus symbols (case BR, without the radial motion) and by the dotted line (case BR + E, with the radial motion). The circular velocity curve based on the stellar velocities is presented by the crosses (case SR, without the radial motion) and by the dashed line (case SR + E, with the radial motion). Panel b: radial velocity as a function of radius for the cases AR + E (open circles), BR + E (plus signs), and SR + E (crosses). The geometric parameters and other characteristics of each case are reported in Table 1. |
| In the text | |
|
Fig. 7. Radial change of the Fourier coefficients a1 (black line) computed from the Hα, Hβ, and stellar component velocity maps. The green curve shows the rotation velocity computed in Sect. 6. Blue circles and red plus signs show the rotation velocity along the approaching and the receding sides of the major axis corrected for the inclination of the galaxy. |
| In the text | |
|
Fig. 8. Radial change of the Fourier coefficients b1 (black line) computed from the Hα, Hβ, and stellar component velocity maps. The green dashed curve shows the radial velocity computed in Sect. 6. The black dashed line marks no radial motion. |
| In the text | |
|
Fig. 9. Radial change of the third harmonics a3 and b3 compared with a two-armed spiral pattern with pitch angle μ2 = 24° and R02 = 4 kpc (red line). Filled circles show the derived values of the third harmonic. The red curves are a model for a two-armed spiral. |
| In the text | |
|
Fig. 10. Radial change of the zero harmonic a0 compared with a model of the first mode of a spiral density wave with the pitch angle μ1 = 12.6° and R01 = 2.6 kpc (red line). |
| In the text | |
Current usage metrics show cumulative count of Article Views (full-text article views including HTML views, PDF and ePub downloads, according to the available data) and Abstracts Views on Vision4Press platform.
Data correspond to usage on the plateform after 2015. The current usage metrics is available 48-96 hours after online publication and is updated daily on week days.
Initial download of the metrics may take a while.