Fig. 7.
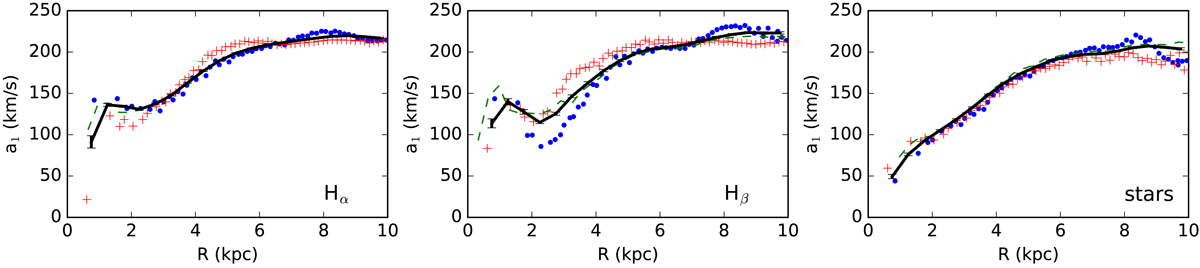
Radial change of the Fourier coefficients a1 (black line) computed from the Hα, Hβ, and stellar component velocity maps. The green curve shows the rotation velocity computed in Sect. 6. Blue circles and red plus signs show the rotation velocity along the approaching and the receding sides of the major axis corrected for the inclination of the galaxy.
Current usage metrics show cumulative count of Article Views (full-text article views including HTML views, PDF and ePub downloads, according to the available data) and Abstracts Views on Vision4Press platform.
Data correspond to usage on the plateform after 2015. The current usage metrics is available 48-96 hours after online publication and is updated daily on week days.
Initial download of the metrics may take a while.