Fig. 2.
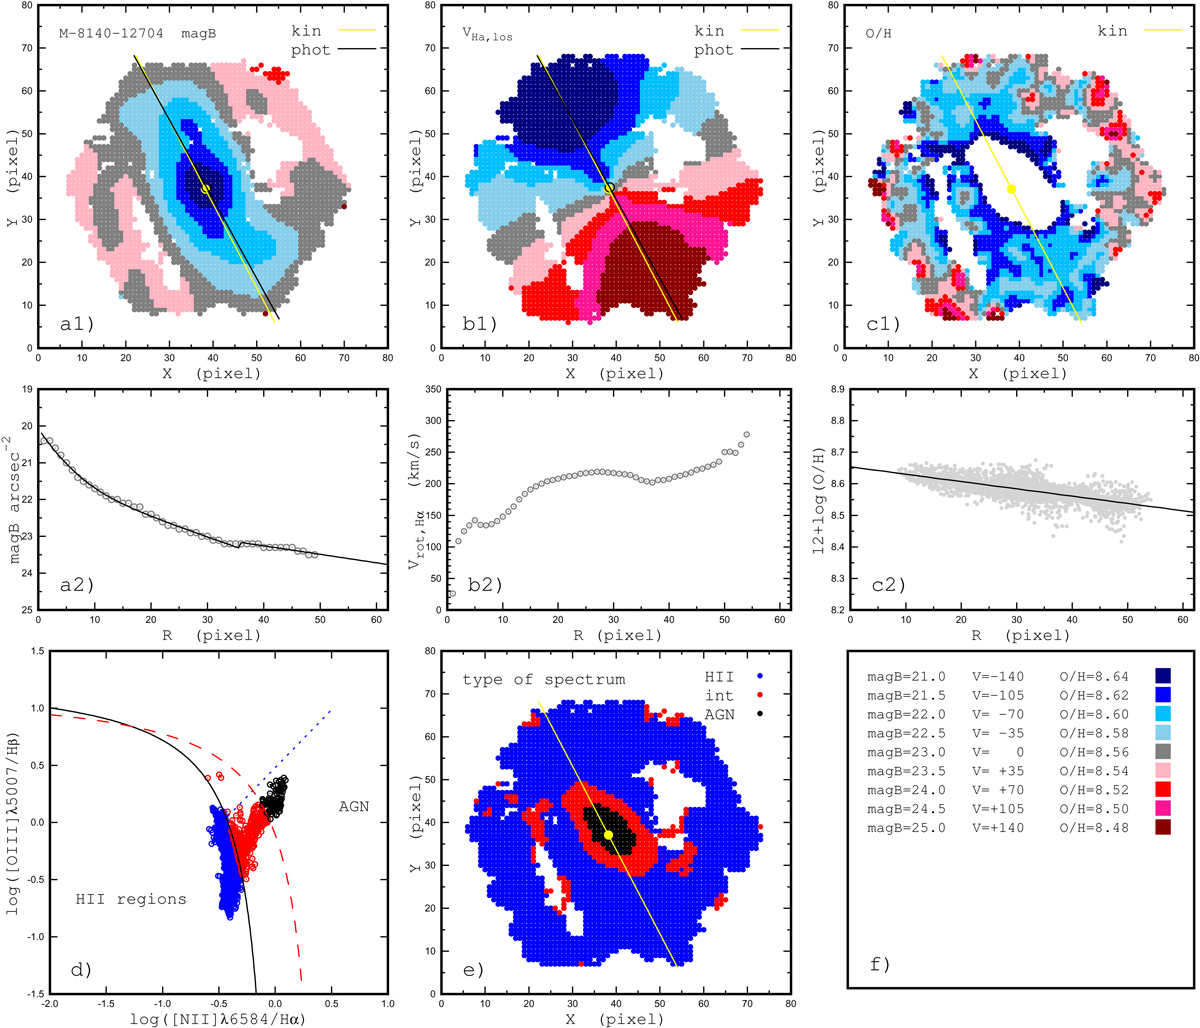
Distributions of the B-band surface brightness (panel a1), the observed (line-of-sight) Hα velocity (panel b1), and the oxygen abundance (panel c1) across the image of the galaxy UGC 4056 in sky coordinates (pixels). Each characteristic is colour-coded as explained in panel f. The circles show the positions of the kinematic (yellow) and photometric (black) centre of the galaxy. The lines indicate the positions of the corresponding major axis of the galaxy. Panel a2: photometric profile constructed with kinematic angles (the inclination and the position of major axis; circles) and bulge-disc decomposition (line). Panels b2 and c2: rotation velocity and the oxygen abundance as a function of radius, respectively. Panel d: BPT diagram for individual spaxels. The solid (dark) and dashed (red) curves mark the demarcation line between AGNs and H II regions defined by Kauffmann et al. (2003) and Kewley et al. (2001), respectively. The dotted (blue) line is the dividing line between Seyfert galaxies and LINERs defined by Cid Fernandes et al. (2010). Panel e: distribution of spaxels with different types of radiation in the spaxel spectra (H II region-like – blue points, intermediate – red points, and AGN-like – black points) over the image of the galaxy. Panel f: explains the colour-coding of the values of the B-band surface brightness (in units of mag arcsec−2), the line-of-sight Hα velocity (in units of km s−1), and the oxygen abundance (in units of dex) used in panels a1, b1, c1. The pixel scale is 0.5 arcsec, the same as the size of the spaxels in the datacube.
Current usage metrics show cumulative count of Article Views (full-text article views including HTML views, PDF and ePub downloads, according to the available data) and Abstracts Views on Vision4Press platform.
Data correspond to usage on the plateform after 2015. The current usage metrics is available 48-96 hours after online publication and is updated daily on week days.
Initial download of the metrics may take a while.