Fig. 8.
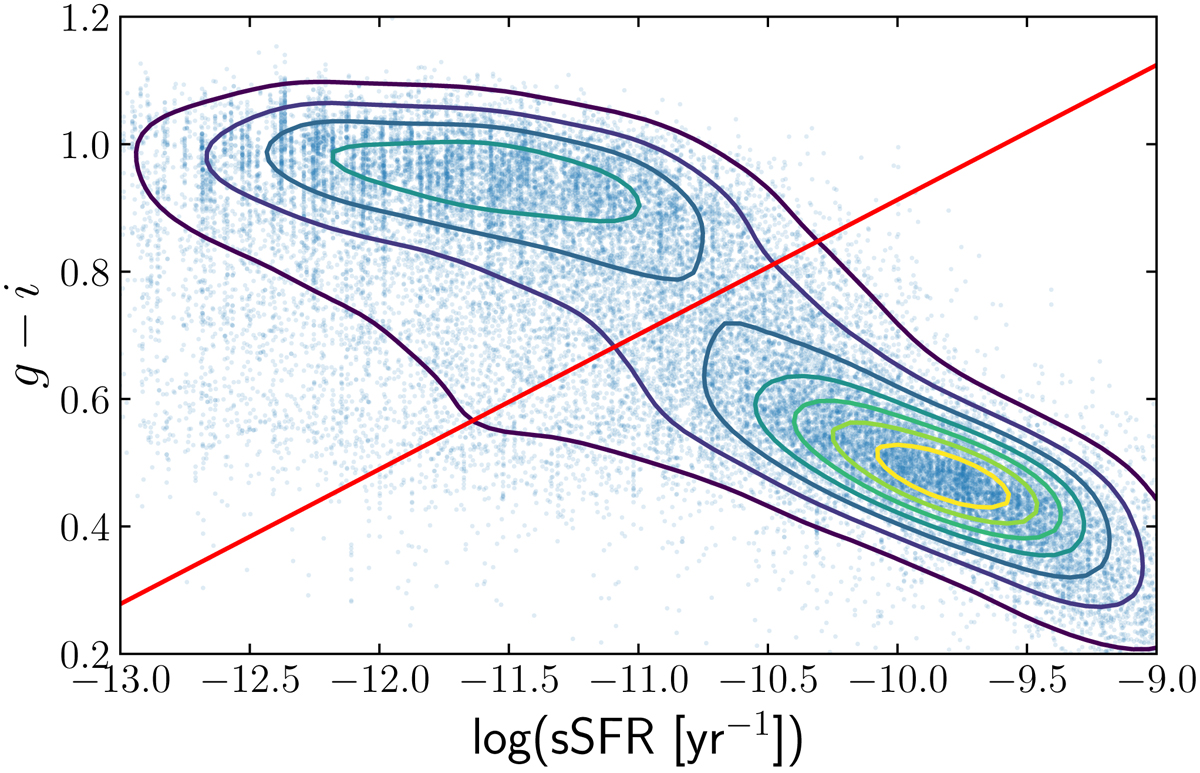
Rest-frame, dust-corrected g − i colour of our satellite galaxy sample against their specific star formation rate. Smoothed density contours are shown, with dense regions appearing more yellow. The red line indicates the cut performed to divide our galaxy sample into blue star forming, and red galaxies with lower star formation rate.
Current usage metrics show cumulative count of Article Views (full-text article views including HTML views, PDF and ePub downloads, according to the available data) and Abstracts Views on Vision4Press platform.
Data correspond to usage on the plateform after 2015. The current usage metrics is available 48-96 hours after online publication and is updated daily on week days.
Initial download of the metrics may take a while.