Free Access
Fig. 5.
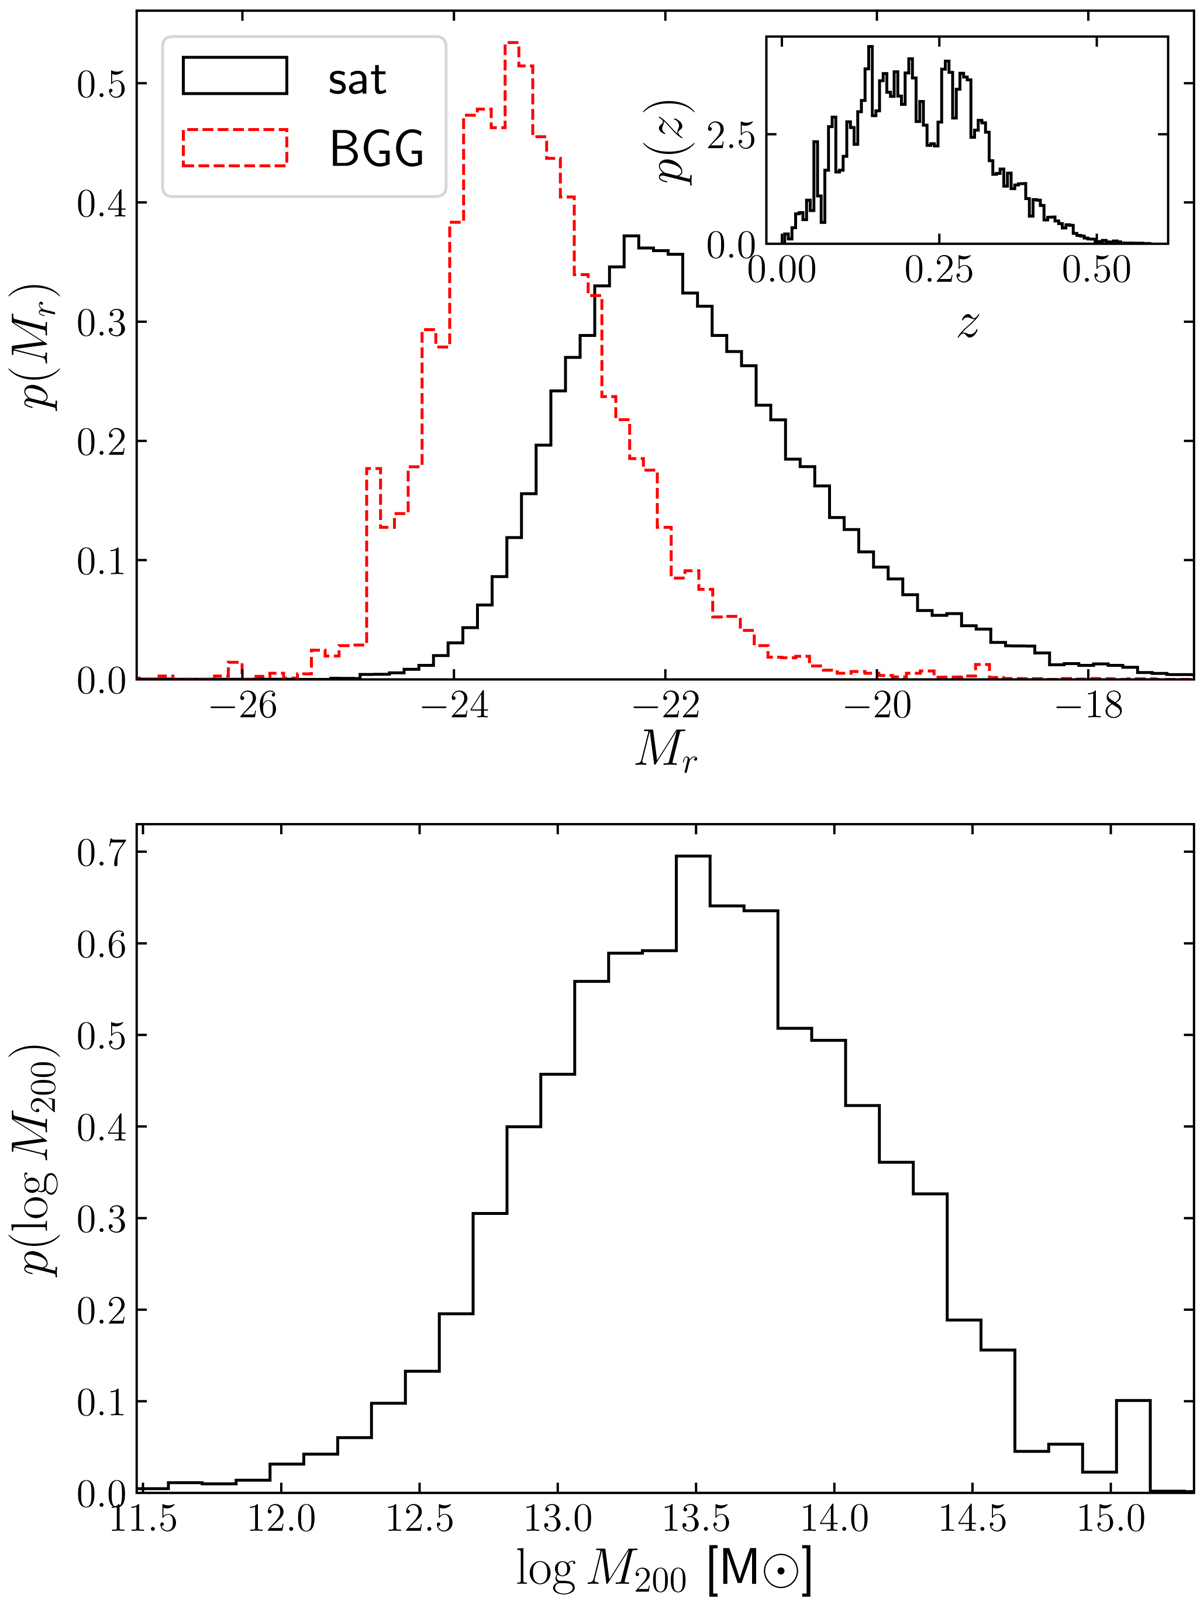
Top: histograms of the absolute r-band magnitude of the BGG (solid black) and satellite (dashed red) galaxy samples. The inset figure shows the distribution of the galaxy group redshifts. Bottom: histogram of the group virial mass, computed with Eq. (6).
Current usage metrics show cumulative count of Article Views (full-text article views including HTML views, PDF and ePub downloads, according to the available data) and Abstracts Views on Vision4Press platform.
Data correspond to usage on the plateform after 2015. The current usage metrics is available 48-96 hours after online publication and is updated daily on week days.
Initial download of the metrics may take a while.