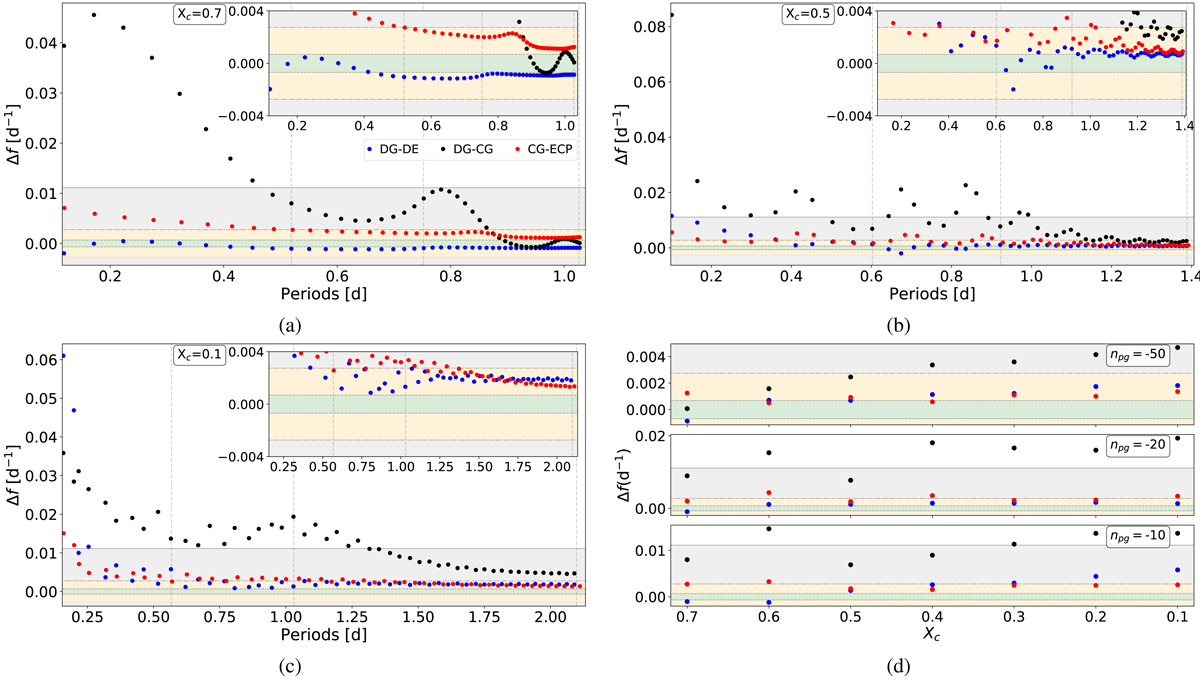
Fig. 2.

Panels a–c: difference in mode frequencies of radial orders npg ∈ [ − 50, −1] of 3.25 M⊙ models between the given mixing prescriptions: diffusive Gumbel (DG), diffusive exponential (DE), convective Gumbel (CG), and extended convective penetration (ECP). The horizontal lines delineate coloured regions that correspond to the Rayleigh limits of light curves of different lengths: solid line and grey area indicate 90-day-long data (K2), the dash-dotted line and yellow area indicate one-year-long light curves (TESS) and the dashed line and green area indicate four-year-long light curves (Kepler). The vertical dashed lines indicate the modes with npg = −10, −20, and −50 from left to right. The inset shows a zoomed version. Panel d: evolution of the frequency differences of certain modes along the main sequence evolution at various core hydrogen fractions.
Current usage metrics show cumulative count of Article Views (full-text article views including HTML views, PDF and ePub downloads, according to the available data) and Abstracts Views on Vision4Press platform.
Data correspond to usage on the plateform after 2015. The current usage metrics is available 48-96 hours after online publication and is updated daily on week days.
Initial download of the metrics may take a while.


