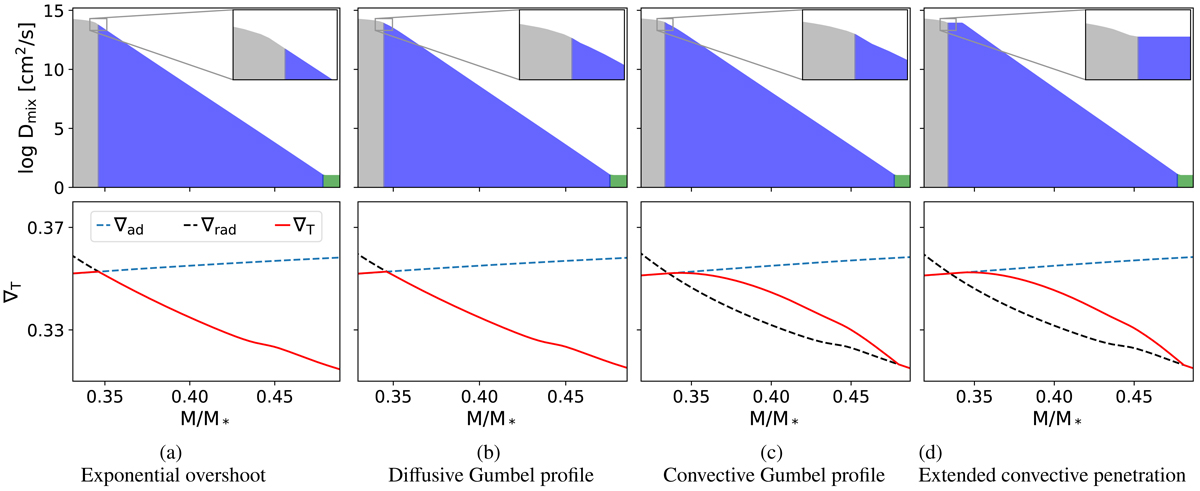
Fig. 1.

Top panels: different shapes of near-core mixing profiles for a star with a mass of 12 M⊙ near the ZAMS. The convective core is indicated in grey, the near-core mixing region in blue, and constant diffusive mixing in the outer radiative envelope in green. Bottom panels: temperature gradients in the same region as the top panels. In each figure the insets are zoomed in on the same region of m/M* and Dmix to show the differences at the edge of the core mixing region more clearly.
Current usage metrics show cumulative count of Article Views (full-text article views including HTML views, PDF and ePub downloads, according to the available data) and Abstracts Views on Vision4Press platform.
Data correspond to usage on the plateform after 2015. The current usage metrics is available 48-96 hours after online publication and is updated daily on week days.
Initial download of the metrics may take a while.


