Open Access
Fig. 3
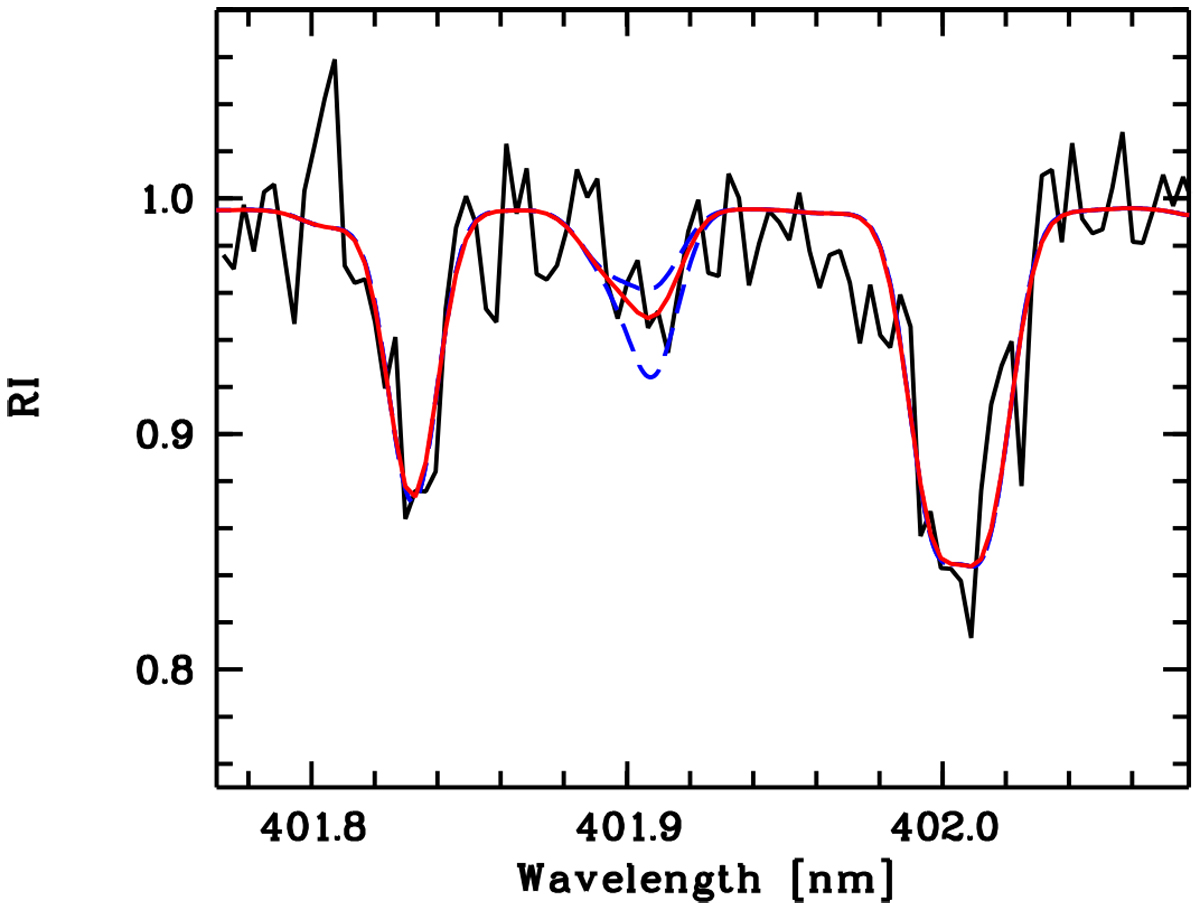
Observed spectrum (solid black) in the range of the 401.9 nm Th II line, compared with the best fit (solid red) providing A(Th) = 0.12, and two synthetic spectra at A(Th) of − 0.3 and 0.5 (dashed blue). The Th II line is blended with a 13CH line, which is taken into account.
Current usage metrics show cumulative count of Article Views (full-text article views including HTML views, PDF and ePub downloads, according to the available data) and Abstracts Views on Vision4Press platform.
Data correspond to usage on the plateform after 2015. The current usage metrics is available 48-96 hours after online publication and is updated daily on week days.
Initial download of the metrics may take a while.