Fig. 2
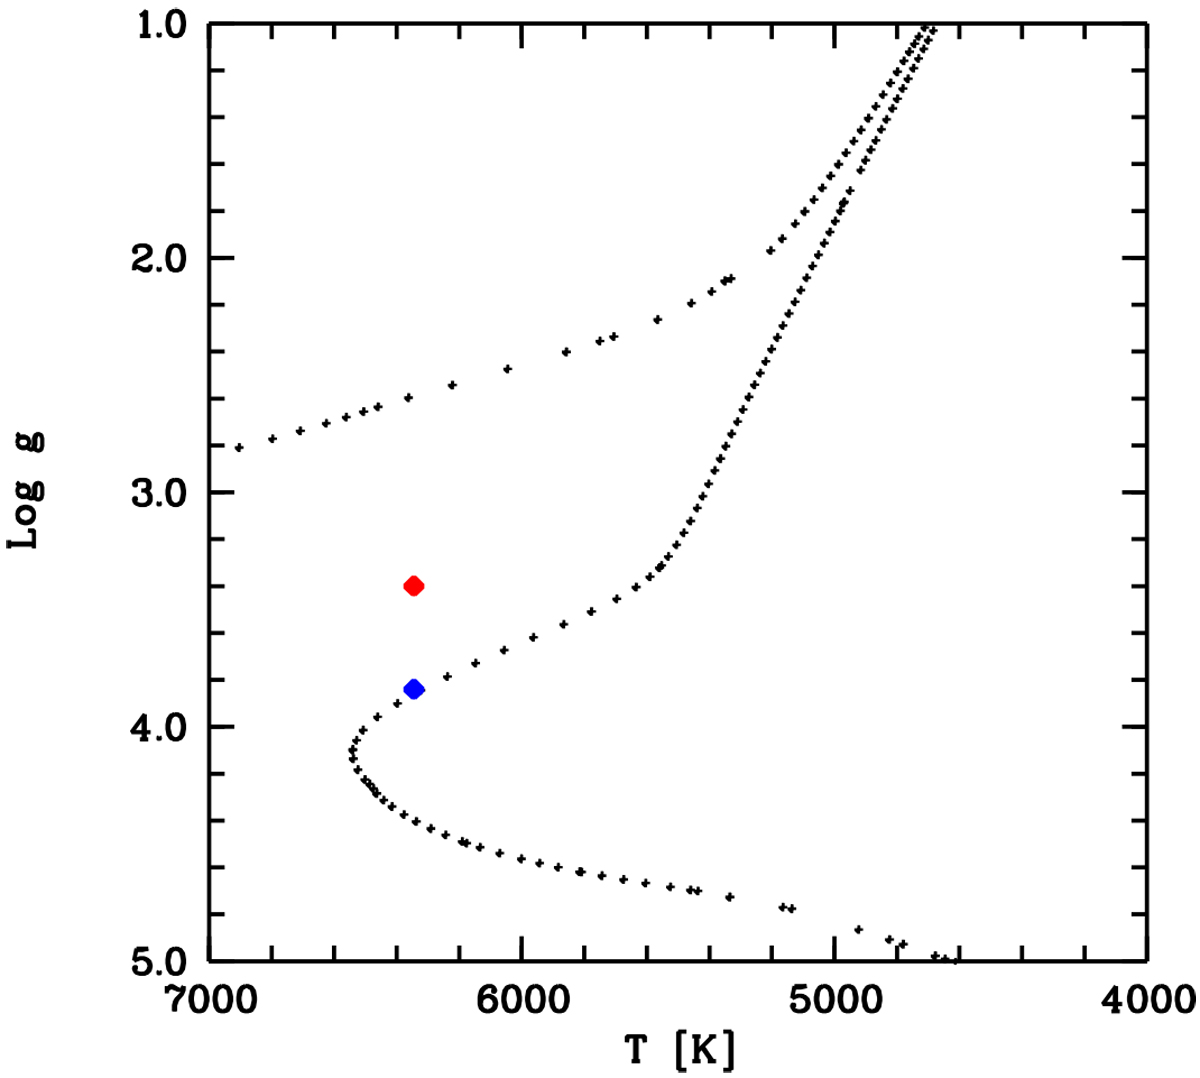
PARSEC isochrone for [M/H] = –2.75 and an age of 10.2 Gyr (small black dots) (from Bressan et al. 2012). The red symbol shows the parameters we derived (Teff from the SDSS photometry and logg from the Fe ionisation equilibrium). The blue symbol on the isochrone corresponds to a log g that is 0.4 dex higher and corresponds to a disagreement in A(Fe) of 0.13 dex between the abundance derived from Fe I lines and that derived from Fe II lines. This value is well within the uncertainties.
Current usage metrics show cumulative count of Article Views (full-text article views including HTML views, PDF and ePub downloads, according to the available data) and Abstracts Views on Vision4Press platform.
Data correspond to usage on the plateform after 2015. The current usage metrics is available 48-96 hours after online publication and is updated daily on week days.
Initial download of the metrics may take a while.