Fig. 1

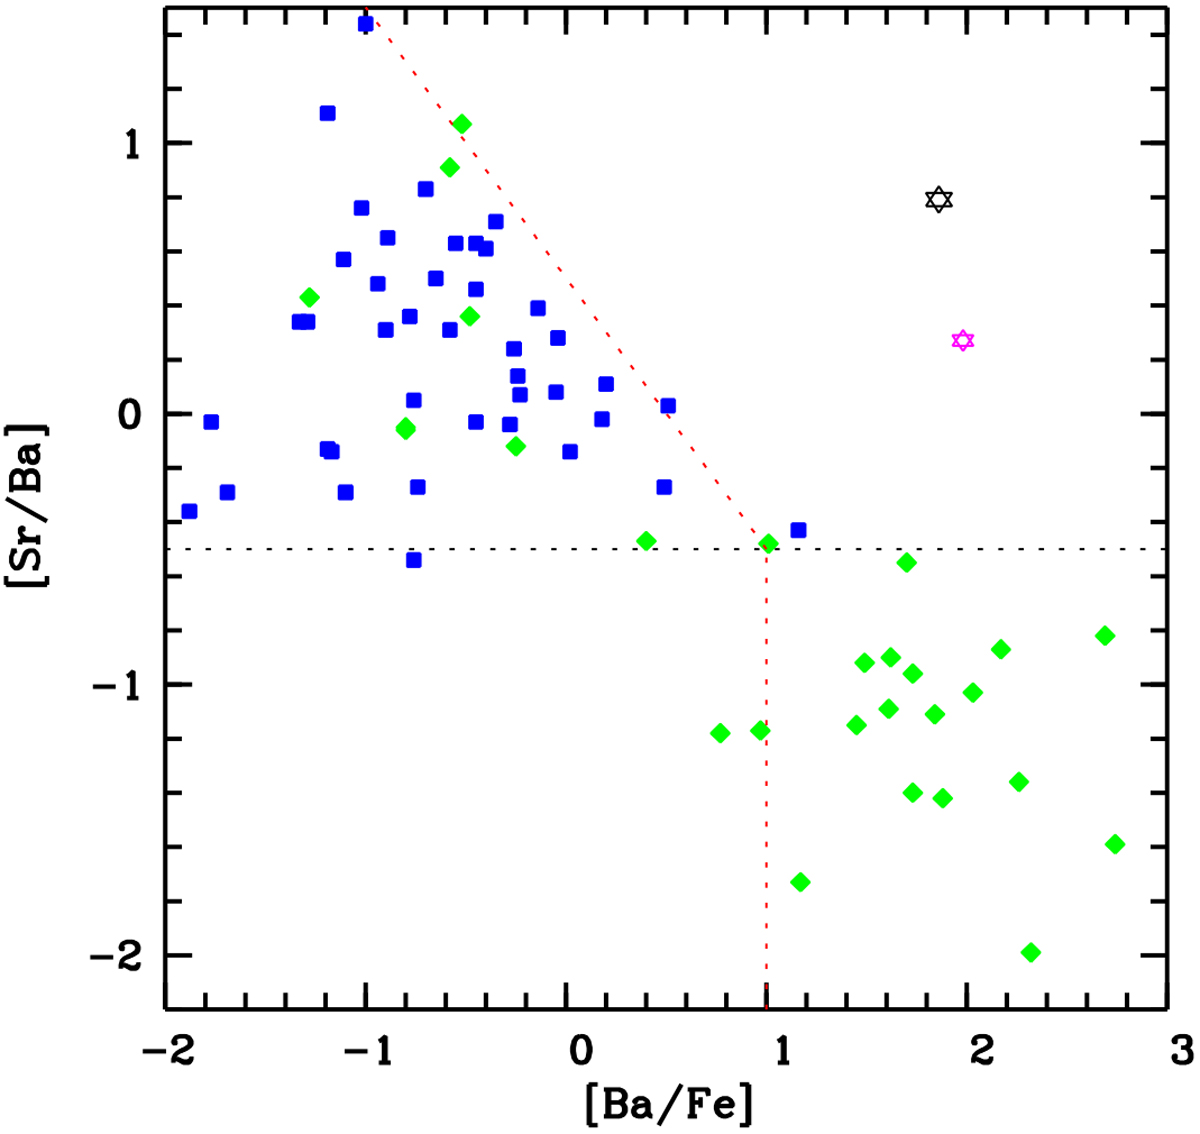
[Ba/Fe] vs. [Sr/Ba] for a sample of metal-poor stars (an updated version of Fig. 1 in Spite et al. 2014). The pink star represents the position of the star J0222–0313 from the analysis of the FORS spectrum (with logg of 4.0; Caffau et al. 2018), while the black star is the result of the investigation of the Mike spectrum, taking into account the NLTE corrections for Sr and Ba. The blue squares are stars from Spite et al. (2005), the green diamonds are CEMP starsfrom the literature (Aoki et al. 2001; Barbuy et al. 2005; Sivarani et al. 2006; Behara et al. 2010; Spite et al. 2013; Yong et al. 2013). The black horizontal dashed line is the r-only solar value for [Sr/Ba] according to Mashonkina & Gehren (2001). Normal stars are in the upper left part of the diagram, sharing the surface with CEMP-no stars; CEMP-s stars are in the lower right part of the diagram.
Current usage metrics show cumulative count of Article Views (full-text article views including HTML views, PDF and ePub downloads, according to the available data) and Abstracts Views on Vision4Press platform.
Data correspond to usage on the plateform after 2015. The current usage metrics is available 48-96 hours after online publication and is updated daily on week days.
Initial download of the metrics may take a while.


