Fig. 2
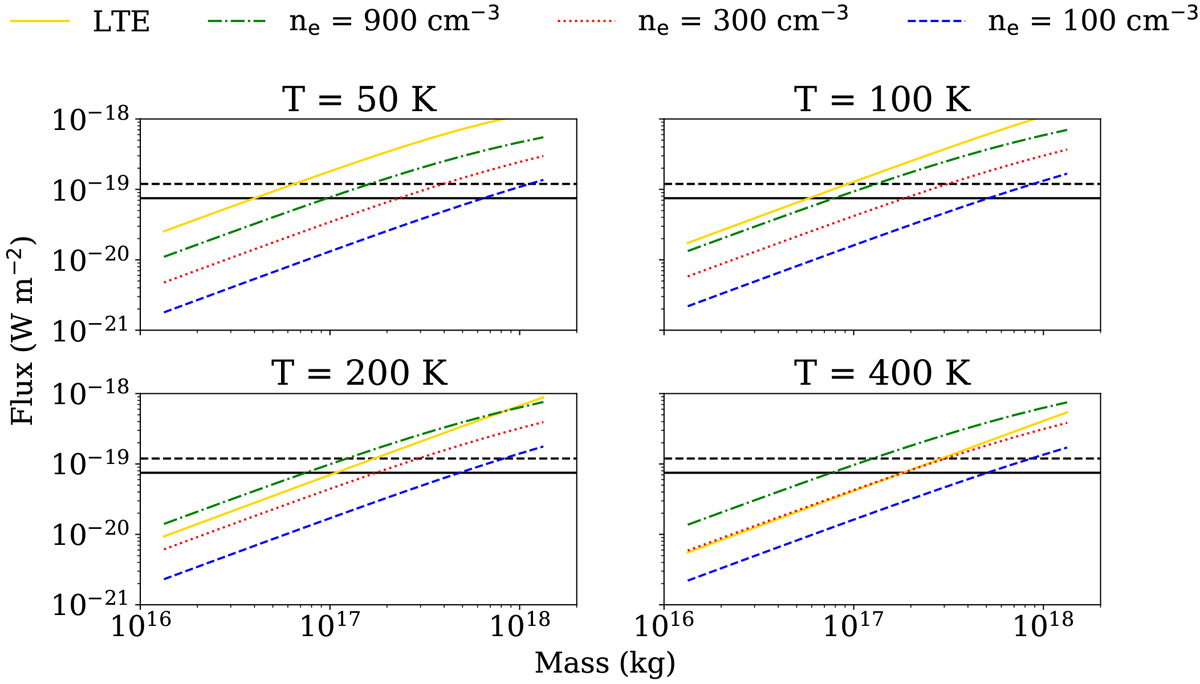
Computed o-H2O 110 –101 flux as a function of H2O gas mass. Four different gas kinetic temperatures are shown; 50 K (top left), 100 K (top right), 200 K (bottom left) and 400 K (bottom right). Solid lines show LTE calculations, while each other line corresponds to an electron density; 100 (dashed), 300 (dotted), and 900 cm−3 (dash-dotted). The horizontal lines in each plot indicate the 95% line flux upper limit obtained from the data (Sect. 3.1). The solid horizontal line corresponds to using a Gaussian profile, and the dashed line to the spectral profile matching the CO.
Current usage metrics show cumulative count of Article Views (full-text article views including HTML views, PDF and ePub downloads, according to the available data) and Abstracts Views on Vision4Press platform.
Data correspond to usage on the plateform after 2015. The current usage metrics is available 48-96 hours after online publication and is updated daily on week days.
Initial download of the metrics may take a while.