Fig. 6
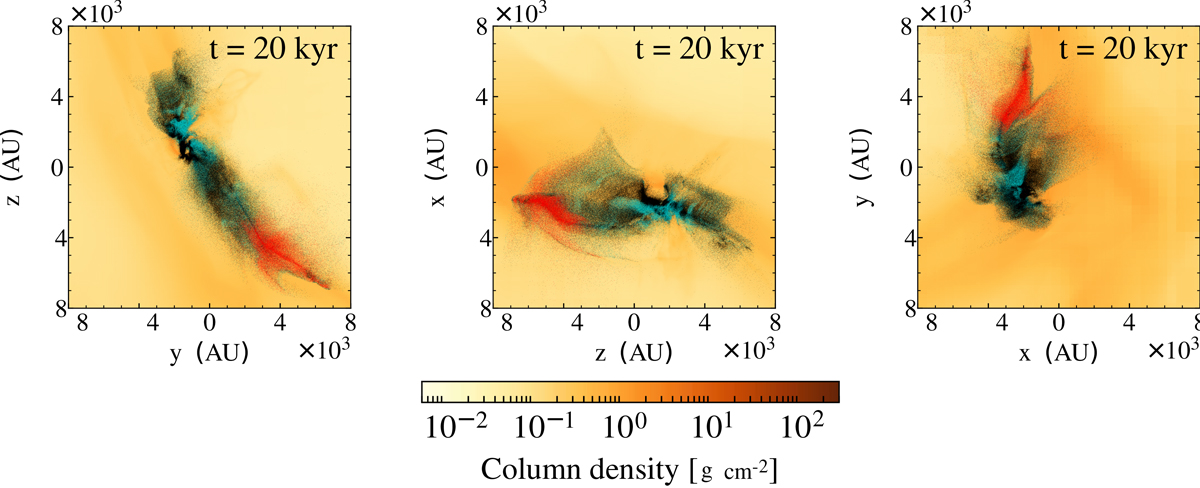
Column density in three planes of coordinate system (width: 1.6 × 10⁴ au; left: yz-plane, middle: zx-plane, right: xy-plane) at time t = 20 × 103 yr after formation of primary A. The colored dots illustrate the origin and dynamics of accreting gas of the individual sinks. Black (cyan, red) dots represent particles that are located within a distance of 30 au from the primary A (B, C) at t = 90 × 103 yr.
Current usage metrics show cumulative count of Article Views (full-text article views including HTML views, PDF and ePub downloads, according to the available data) and Abstracts Views on Vision4Press platform.
Data correspond to usage on the plateform after 2015. The current usage metrics is available 48-96 hours after online publication and is updated daily on week days.
Initial download of the metrics may take a while.