Fig. 9
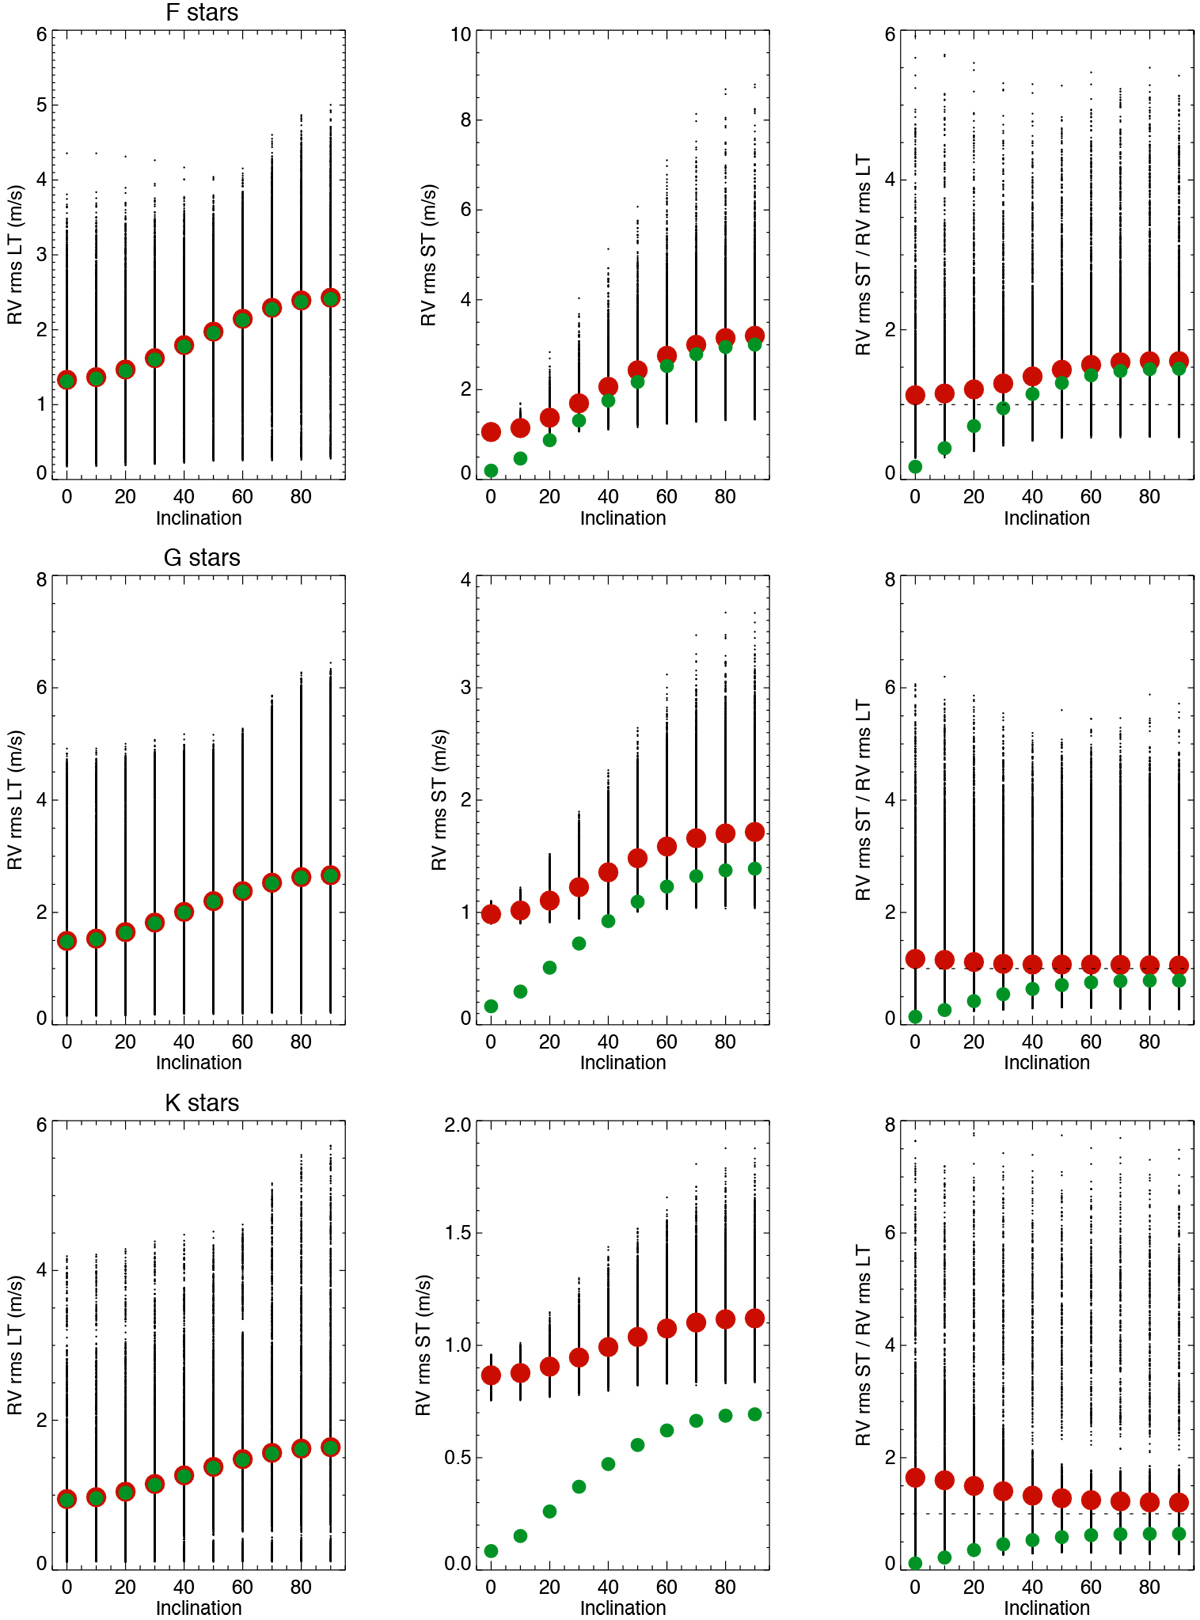
Left column: long-term RV jitter vs. inclination (all simulations, black dots, and average, red points) for F stars (upper panel), G stars (middle panel), and K stars (lower panel) for activity and OGS contributions. The green points are the average values for activity alone. Middle column: same for the short-term RV jitter. Right column: same for the ratio between short-term RV jitter and long-term RV jitter.
Current usage metrics show cumulative count of Article Views (full-text article views including HTML views, PDF and ePub downloads, according to the available data) and Abstracts Views on Vision4Press platform.
Data correspond to usage on the plateform after 2015. The current usage metrics is available 48-96 hours after online publication and is updated daily on week days.
Initial download of the metrics may take a while.