Fig. 8
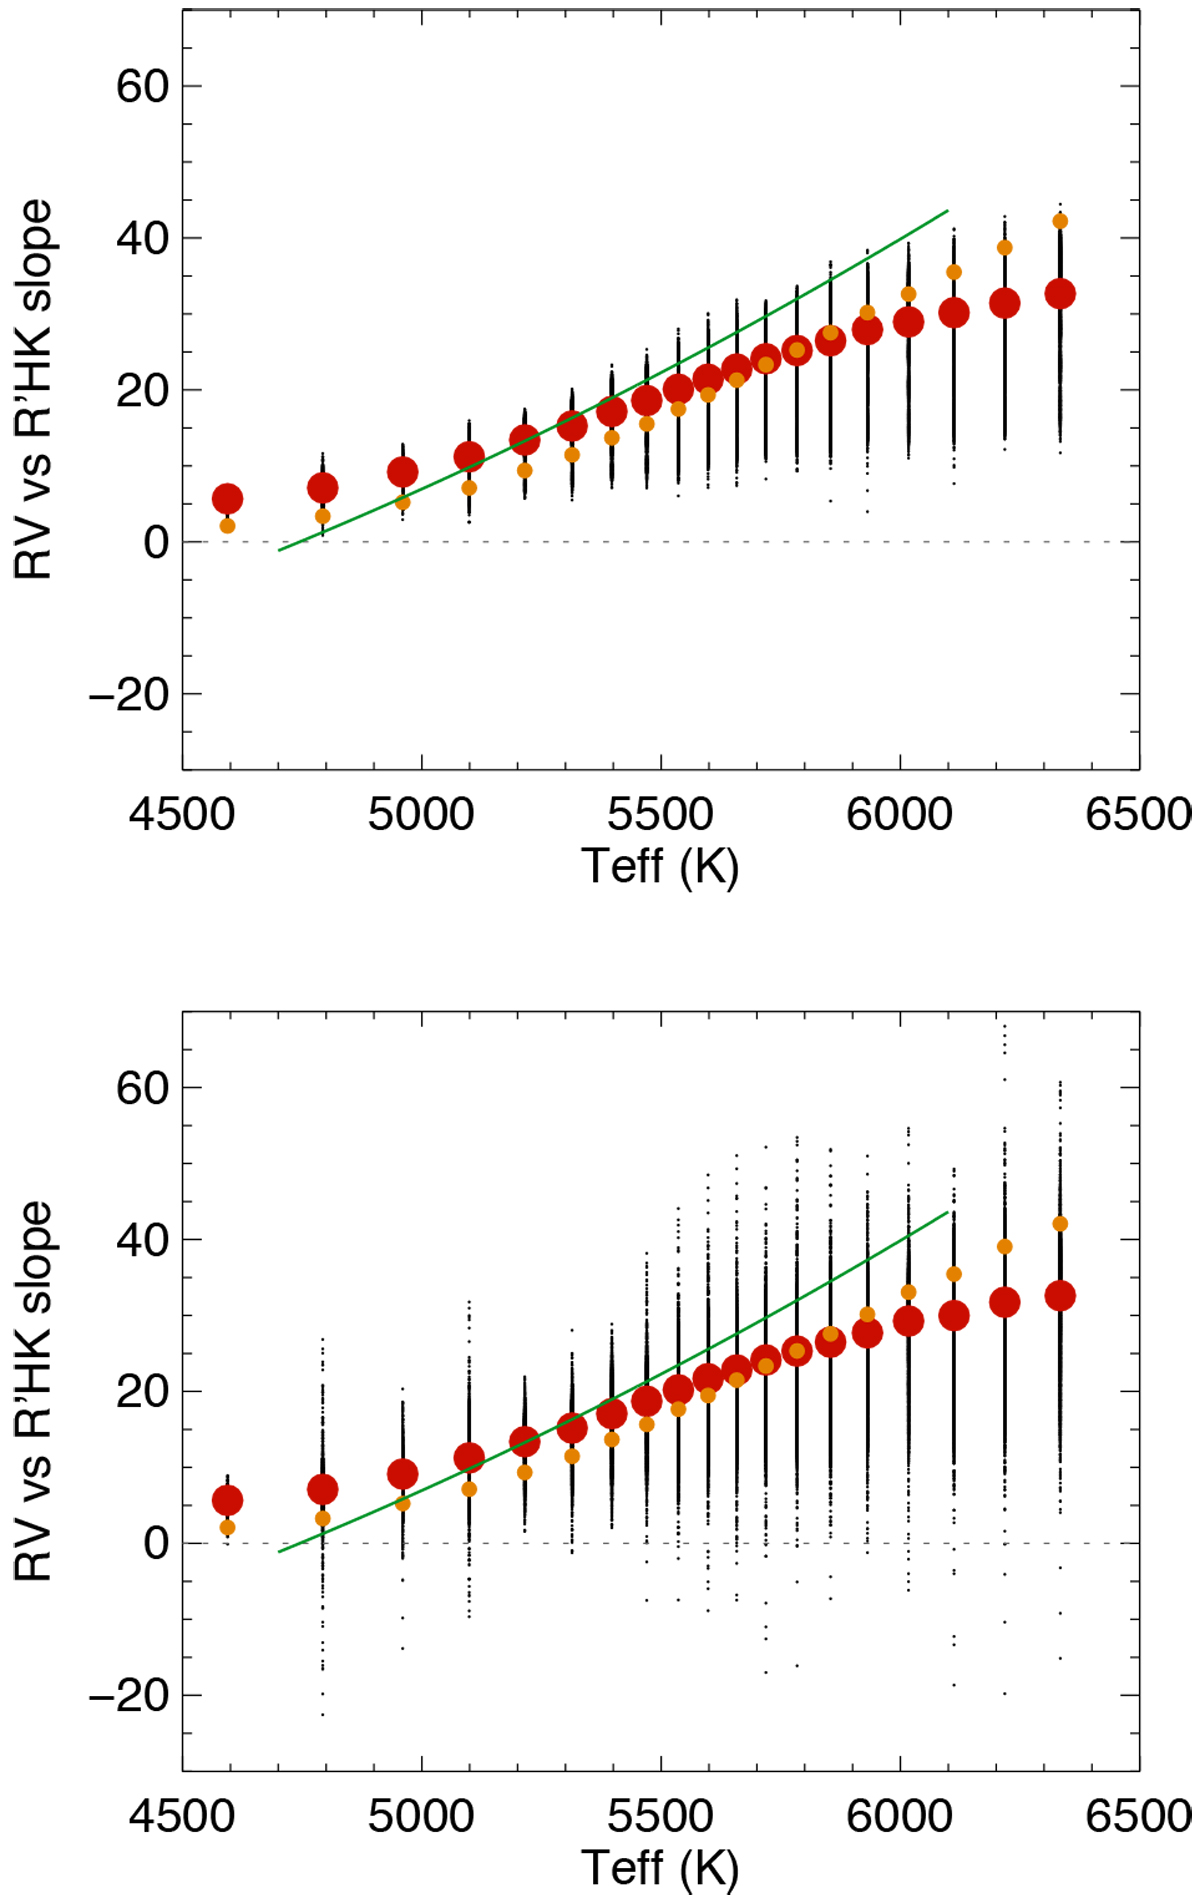
Upper panel: slope of RV vs. ![]() , shown as a function of Teff. The red points indicate the average slope for each Teff bin. The green line is the trend fit to observations in Lovis et al. (2011). The orange points correspond to the average when the trend vs. Teff in the convective blueshift inhibition law (which we estimate is not valid below 5300 K) is taken into account. Lower panel: same with degraded sampling, either 100, 500, 1000, or 2000 points depending on the simulation (see text).
, shown as a function of Teff. The red points indicate the average slope for each Teff bin. The green line is the trend fit to observations in Lovis et al. (2011). The orange points correspond to the average when the trend vs. Teff in the convective blueshift inhibition law (which we estimate is not valid below 5300 K) is taken into account. Lower panel: same with degraded sampling, either 100, 500, 1000, or 2000 points depending on the simulation (see text).
Current usage metrics show cumulative count of Article Views (full-text article views including HTML views, PDF and ePub downloads, according to the available data) and Abstracts Views on Vision4Press platform.
Data correspond to usage on the plateform after 2015. The current usage metrics is available 48-96 hours after online publication and is updated daily on week days.
Initial download of the metrics may take a while.