Fig. 7
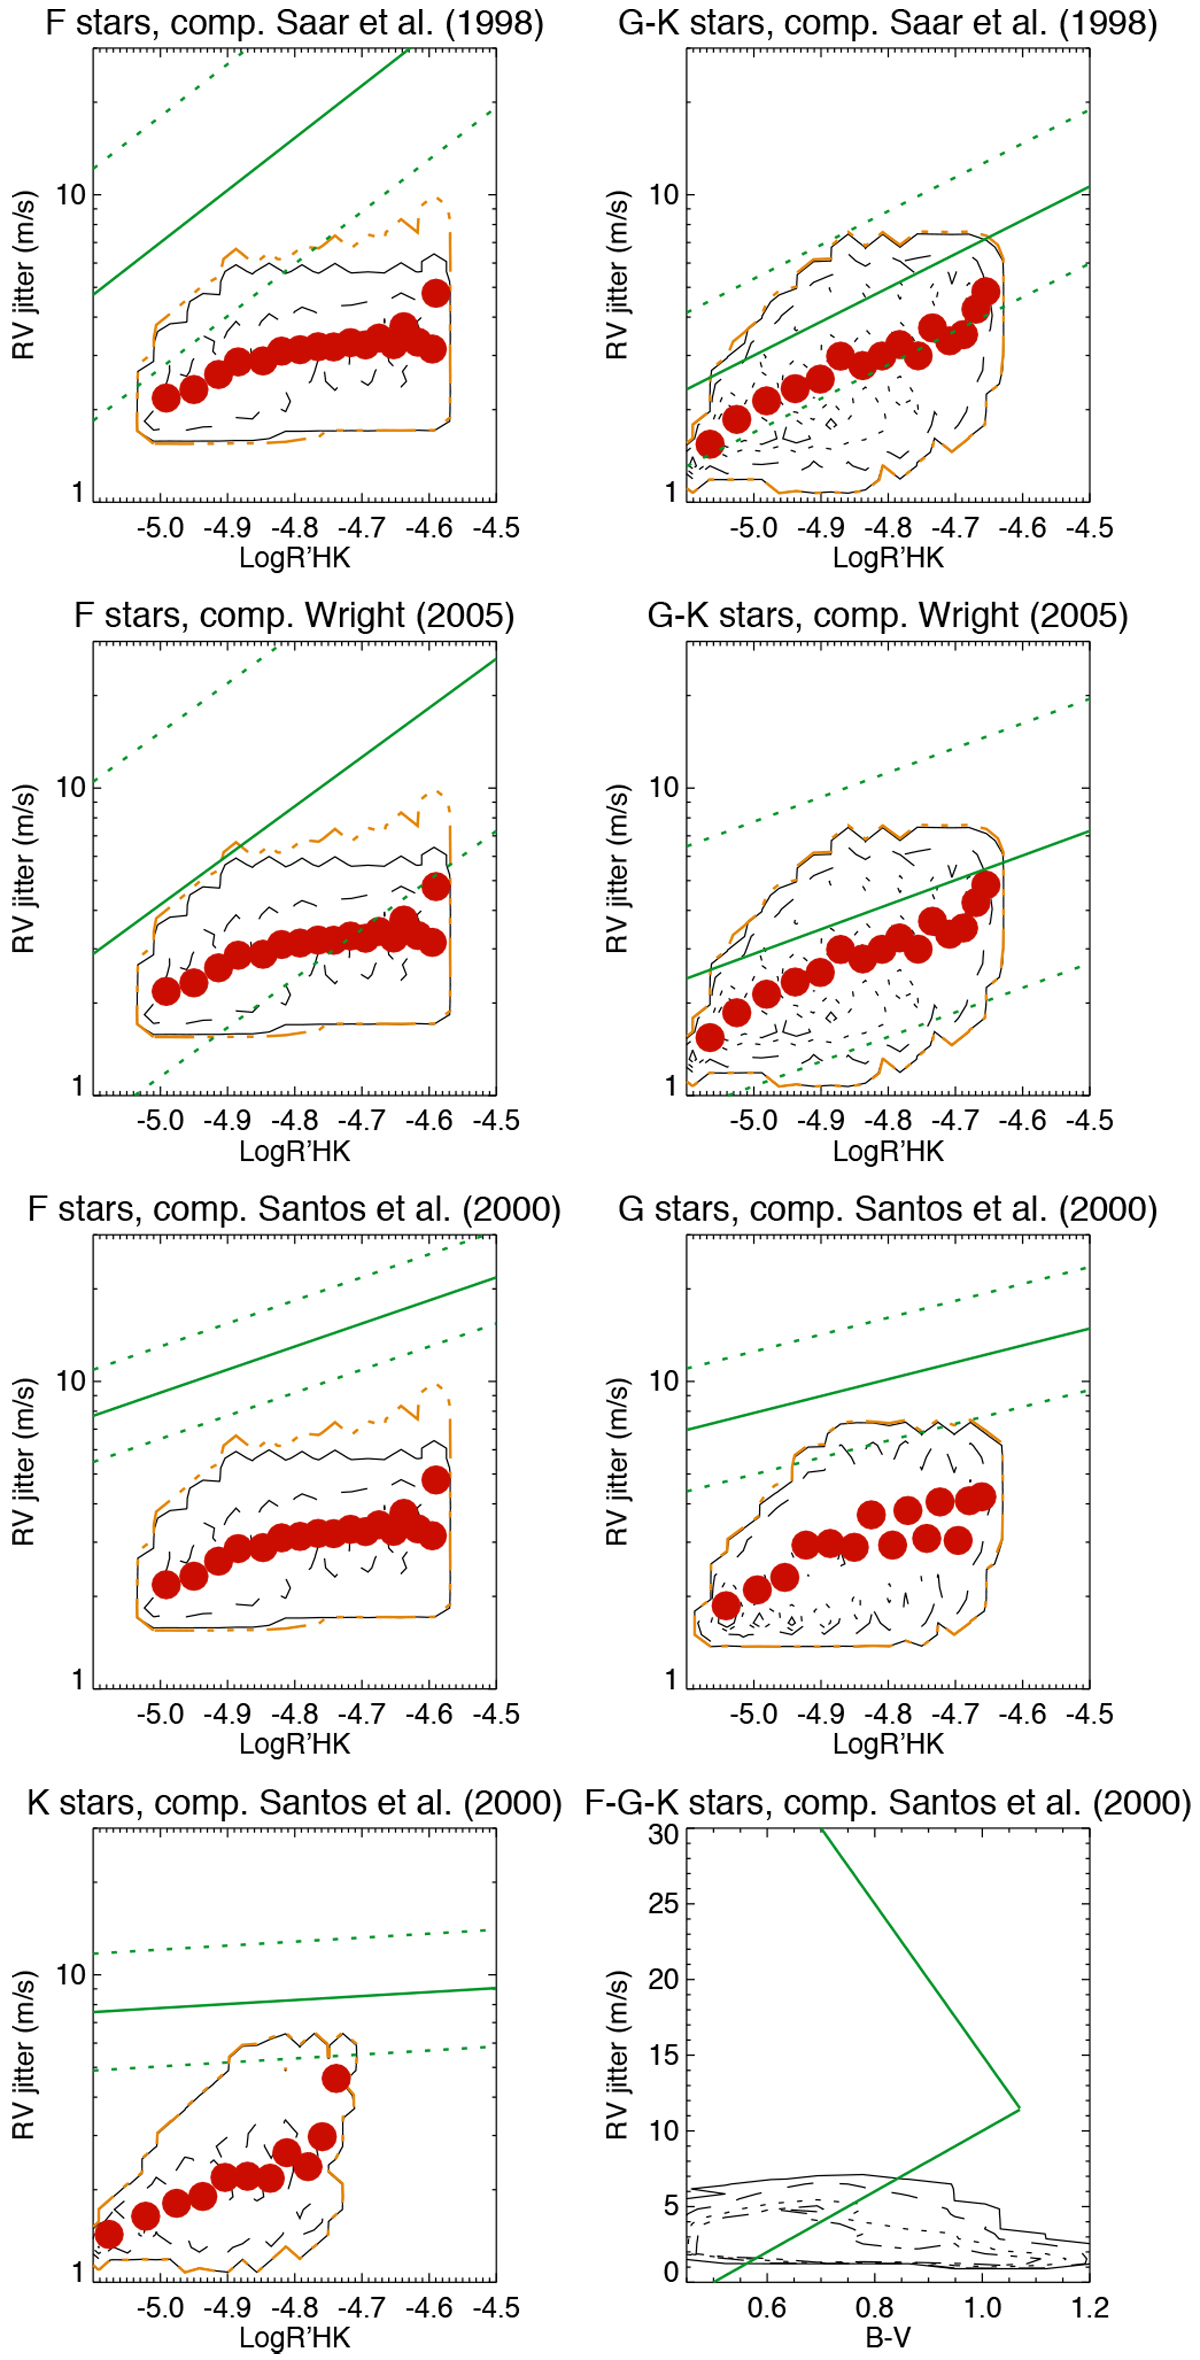
First line: RV jitter for F stars (left) and G+K stars (right) vs. Log ![]() for all our simulations, in red (averaged in Log
for all our simulations, in red (averaged in Log ![]() bins, ΔTspot1), black contours (levels for 1, 100, 500, and 1000 simulations, ΔTspot1), and orange contours (level-one simulation, ΔTspot2). The green solid line indicates the law derived by Saar et al. (1998), and the two dashed green lines indicate the approximate range of RV jitter that was covered by their observations. Second line: same with a comparisonwith Wright (2005). Third and fourth lines: same with a comparison with Santos et al. (2000) for the first three panels (F, G, and K separately). The last panel represents the entire RV jitter vs. B− V. The two green lines indicate the lower and upper bounds of RV jitter values found by Santos et al. (2000).
bins, ΔTspot1), black contours (levels for 1, 100, 500, and 1000 simulations, ΔTspot1), and orange contours (level-one simulation, ΔTspot2). The green solid line indicates the law derived by Saar et al. (1998), and the two dashed green lines indicate the approximate range of RV jitter that was covered by their observations. Second line: same with a comparisonwith Wright (2005). Third and fourth lines: same with a comparison with Santos et al. (2000) for the first three panels (F, G, and K separately). The last panel represents the entire RV jitter vs. B− V. The two green lines indicate the lower and upper bounds of RV jitter values found by Santos et al. (2000).
Current usage metrics show cumulative count of Article Views (full-text article views including HTML views, PDF and ePub downloads, according to the available data) and Abstracts Views on Vision4Press platform.
Data correspond to usage on the plateform after 2015. The current usage metrics is available 48-96 hours after online publication and is updated daily on week days.
Initial download of the metrics may take a while.