Fig. 2
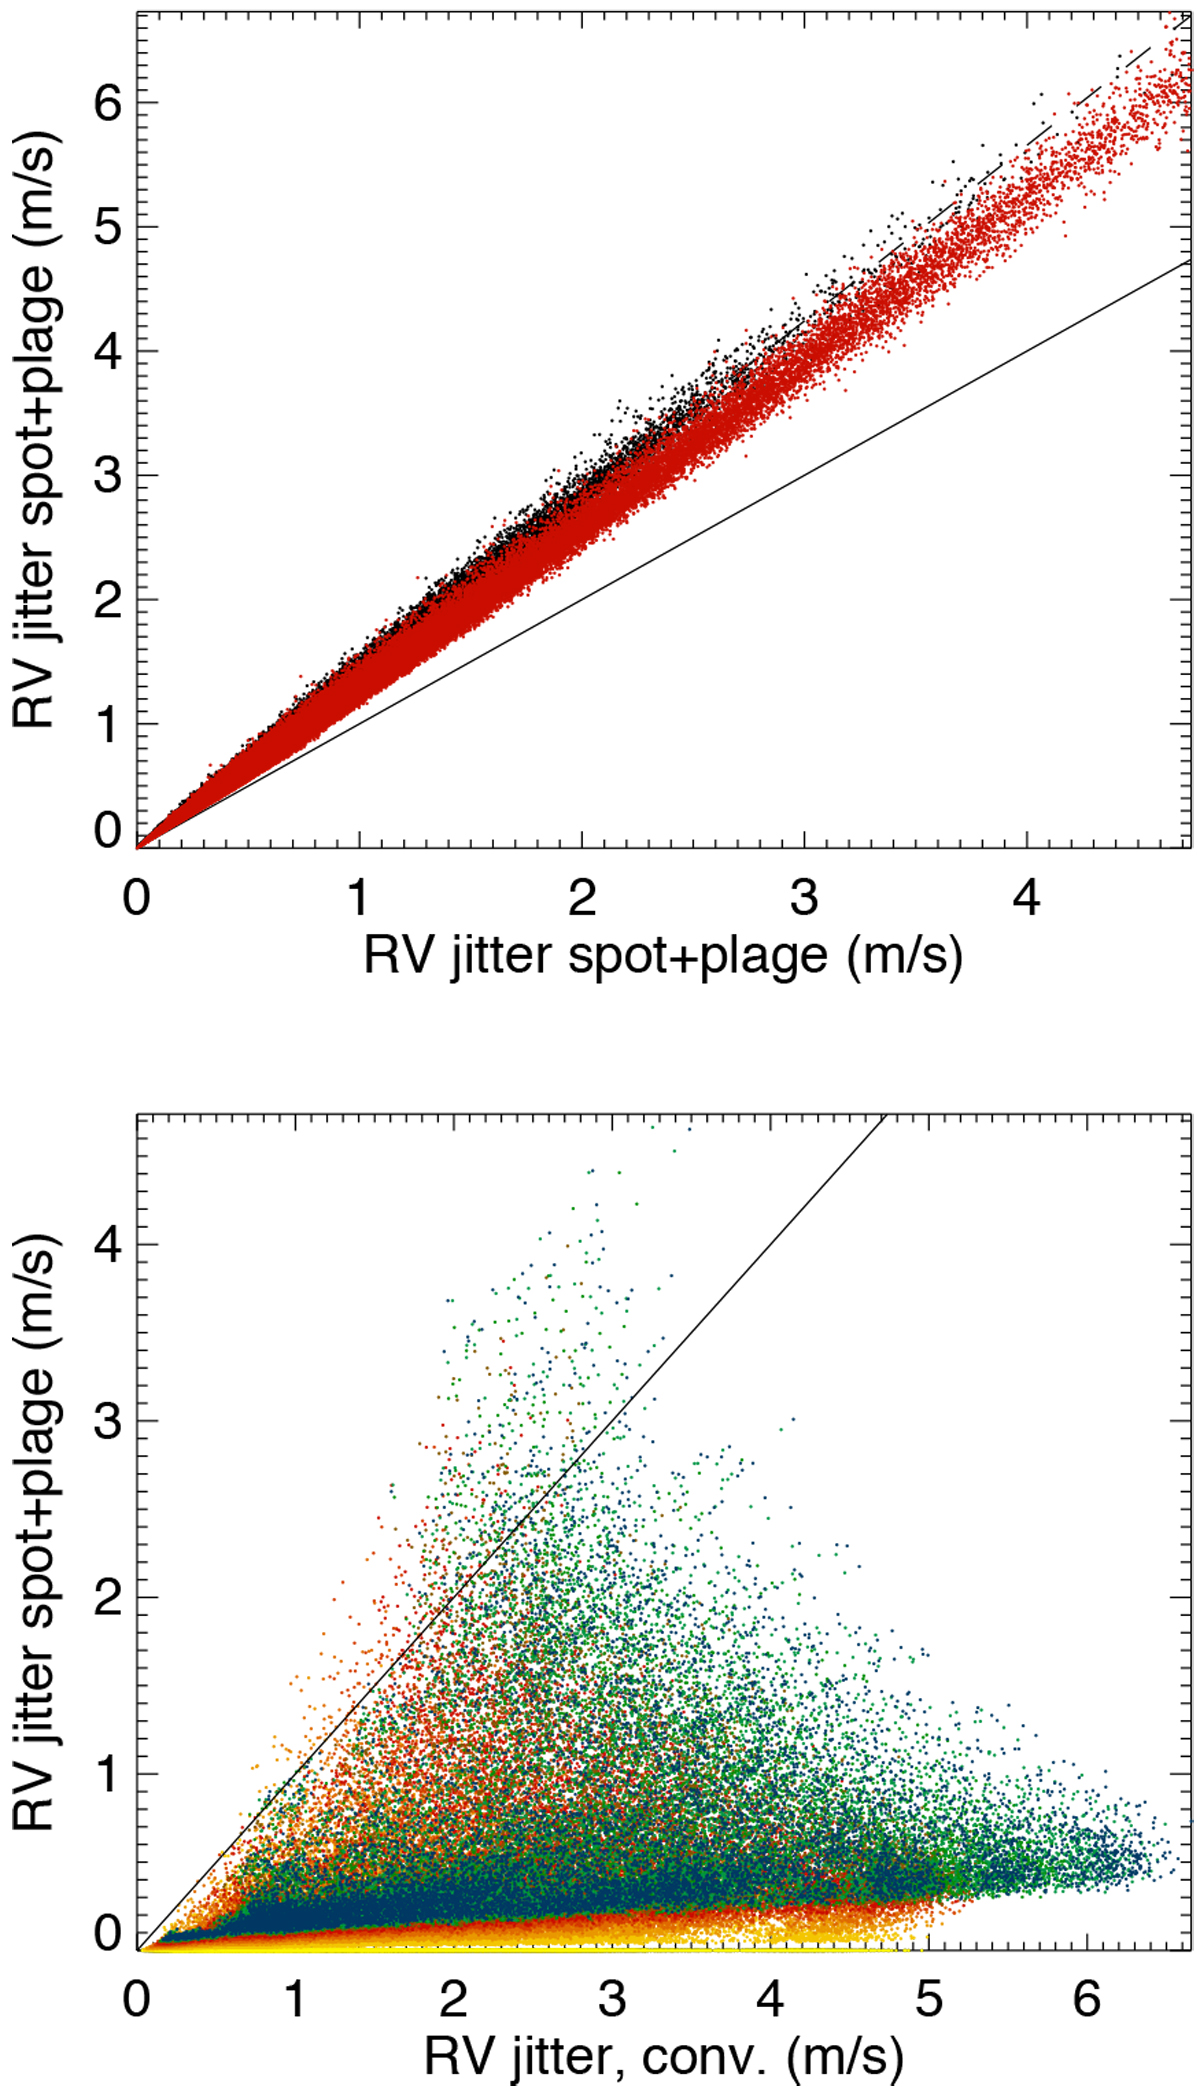
Upper panel: root mean square of the RV jitter due to spot (rvspot1 in black and rvspot2 in red)) and plages separately vs. the RV jitter of rvspot + rvplage. The solid line indicates a y = x linear function and the dashed line has a slope of ![]() . Lower panel: RV jitter of rvspot1 + rvplage vs. the RV jitter of rvconv. The color code is similar to Fig. 1. The RV jitter of simulations above the solid line arises because rvspot1+rvplage is larger than the RV jitter due to rvconv.
. Lower panel: RV jitter of rvspot1 + rvplage vs. the RV jitter of rvconv. The color code is similar to Fig. 1. The RV jitter of simulations above the solid line arises because rvspot1+rvplage is larger than the RV jitter due to rvconv.
Current usage metrics show cumulative count of Article Views (full-text article views including HTML views, PDF and ePub downloads, according to the available data) and Abstracts Views on Vision4Press platform.
Data correspond to usage on the plateform after 2015. The current usage metrics is available 48-96 hours after online publication and is updated daily on week days.
Initial download of the metrics may take a while.