Fig. 3.
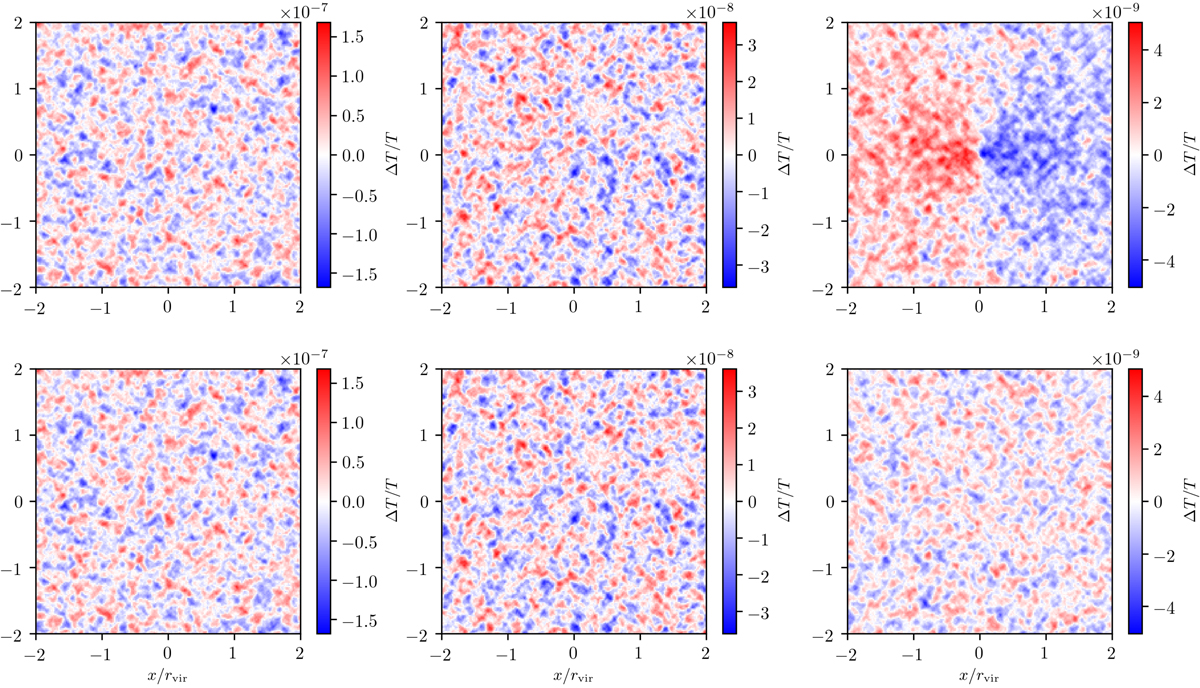
Example realisations of the stacks (top row), and the residuals (bottom row) after stacking the slingshot signal of 8438 halos and subtracting the best fit. Left panels: noise per pixel of σΔT/T = 4 × 10⁻⁶, resembling current surveys. Central panels: “near-future” noise levels of σΔT/T = 1 × 10⁻⁶, and rightmost panels: very low noise per pixel (σΔT/T = 1 × 10⁻⁷) to visually see the emergence of an image. The individual images are scaled with respect to the virial radius of the halo before stacking. The x- and y-axes are in units of the virial radius of the halo.
Current usage metrics show cumulative count of Article Views (full-text article views including HTML views, PDF and ePub downloads, according to the available data) and Abstracts Views on Vision4Press platform.
Data correspond to usage on the plateform after 2015. The current usage metrics is available 48-96 hours after online publication and is updated daily on week days.
Initial download of the metrics may take a while.