Fig. 2.
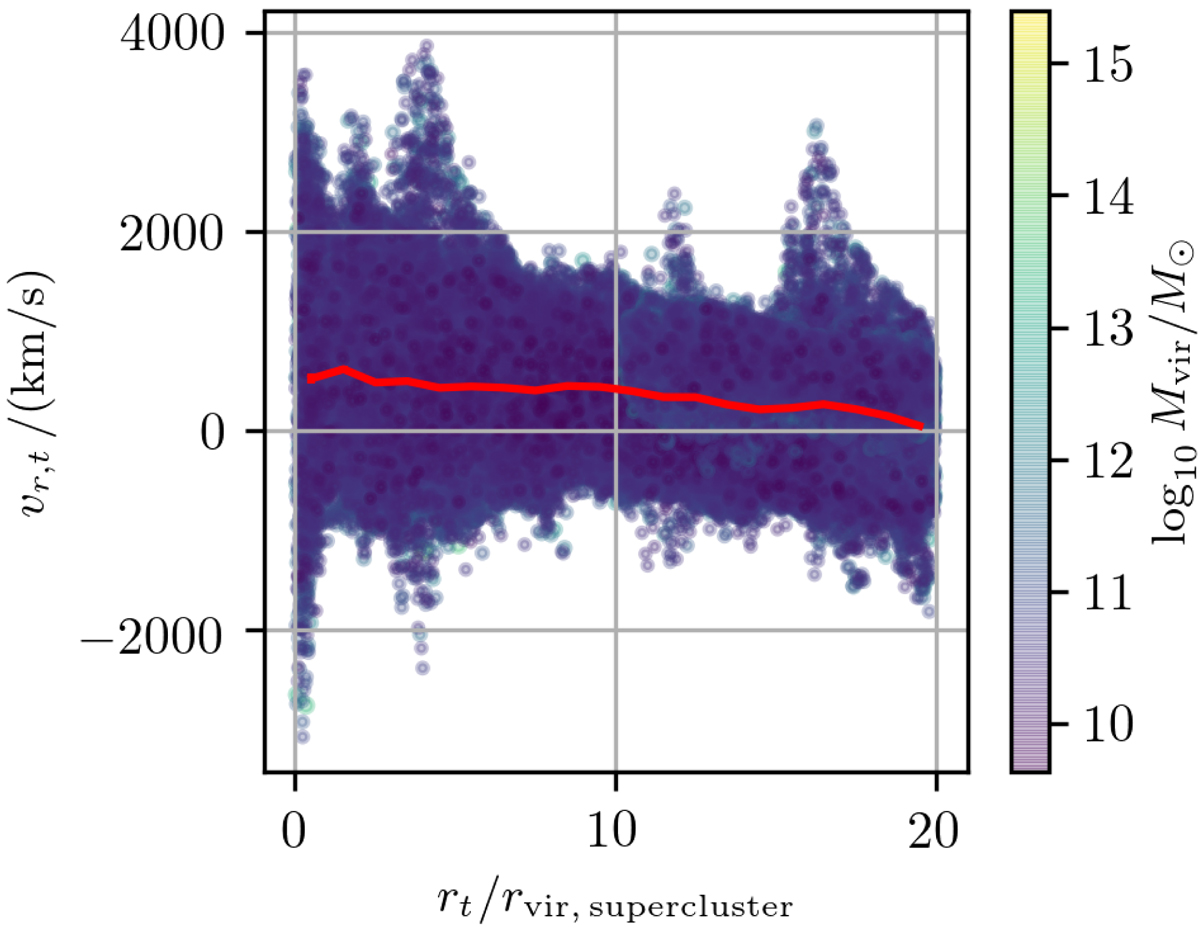
Scatter plot of the projected radial motion of halos close to the massive supercluster. The horizontal axis shows the projected distance from the centre of the structure (in units of the virial radius of the supercluster). The vertical axis shows the projected radial velocity of the halo in question; positive values indicate infalling motion. The red line shows the binned mean. The error of the mean is consistent with the width of the line. The colour of a point indicates the virial mass of that halo.
Current usage metrics show cumulative count of Article Views (full-text article views including HTML views, PDF and ePub downloads, according to the available data) and Abstracts Views on Vision4Press platform.
Data correspond to usage on the plateform after 2015. The current usage metrics is available 48-96 hours after online publication and is updated daily on week days.
Initial download of the metrics may take a while.