Fig. 4.
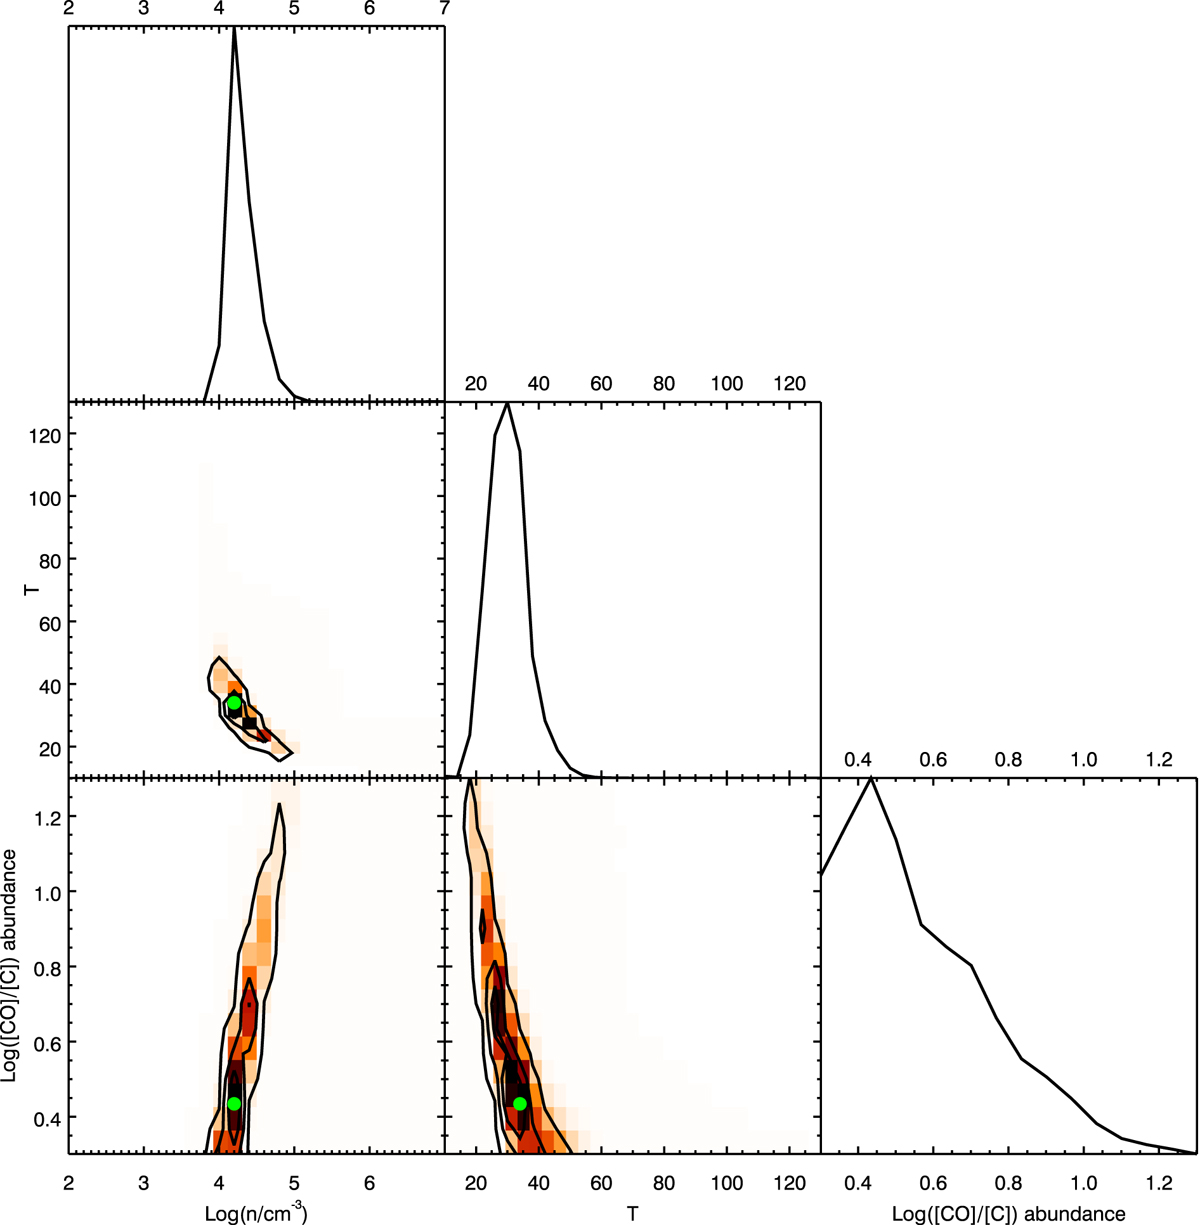
Likelihood corner plots for the parameters in our LVG model. Internal panels give the two-dimensional likelihoods of density, temperature, and [CO]/[C] abundance. Top right panels: give their one-dimensional marginalized likelihoods. Contour levels enclose the 95, 68, and 38% most likely regions of each parameter space. A green dot indicates the best-fit model shown in Fig. 3.
Current usage metrics show cumulative count of Article Views (full-text article views including HTML views, PDF and ePub downloads, according to the available data) and Abstracts Views on Vision4Press platform.
Data correspond to usage on the plateform after 2015. The current usage metrics is available 48-96 hours after online publication and is updated daily on week days.
Initial download of the metrics may take a while.