Fig. 3.
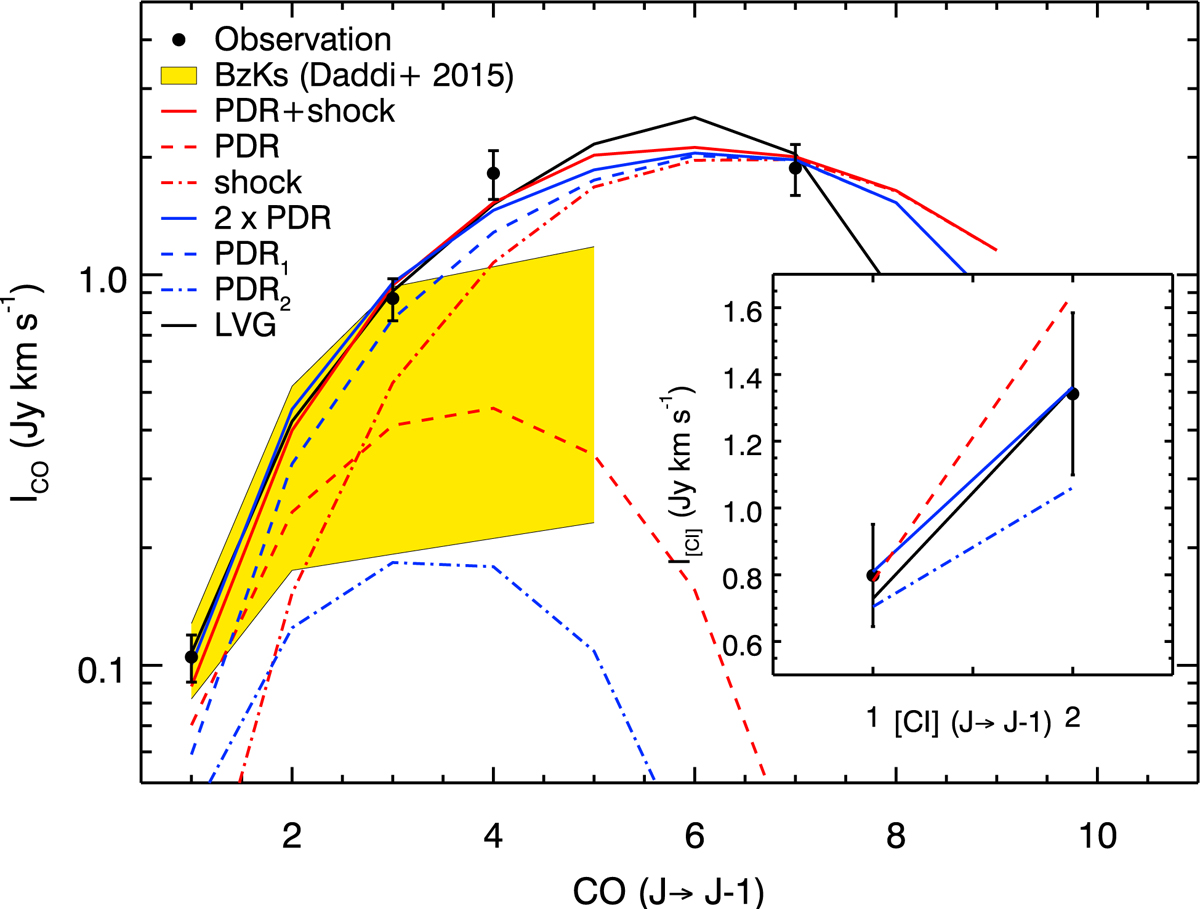
Observations of CO and [CI] compared to models. Line observations are given by black circles and corresponding error bars. Yellow swath shows CO SLED for z ∼ 1.5 BzK galaxies from Daddi et al. (2015) for comparison (normalized by CO(1-0) or CO(2-1)). The main figure corresponds to CO observations, while the inset figure corresponds to [CI] (note different axis scale). The LVG best-fit model is shown as a black solid line. The PDR plus shock best-fit model is shown as a solid red line with the contributing PDR and shock components shown as dashed and dash-dotted red lines, respectively. The two-PDR-component best-fit model is shown as a solid blue line with the contributing PDR components shown as dashed and dash-dotted blue lines.
Current usage metrics show cumulative count of Article Views (full-text article views including HTML views, PDF and ePub downloads, according to the available data) and Abstracts Views on Vision4Press platform.
Data correspond to usage on the plateform after 2015. The current usage metrics is available 48-96 hours after online publication and is updated daily on week days.
Initial download of the metrics may take a while.