Fig. 6
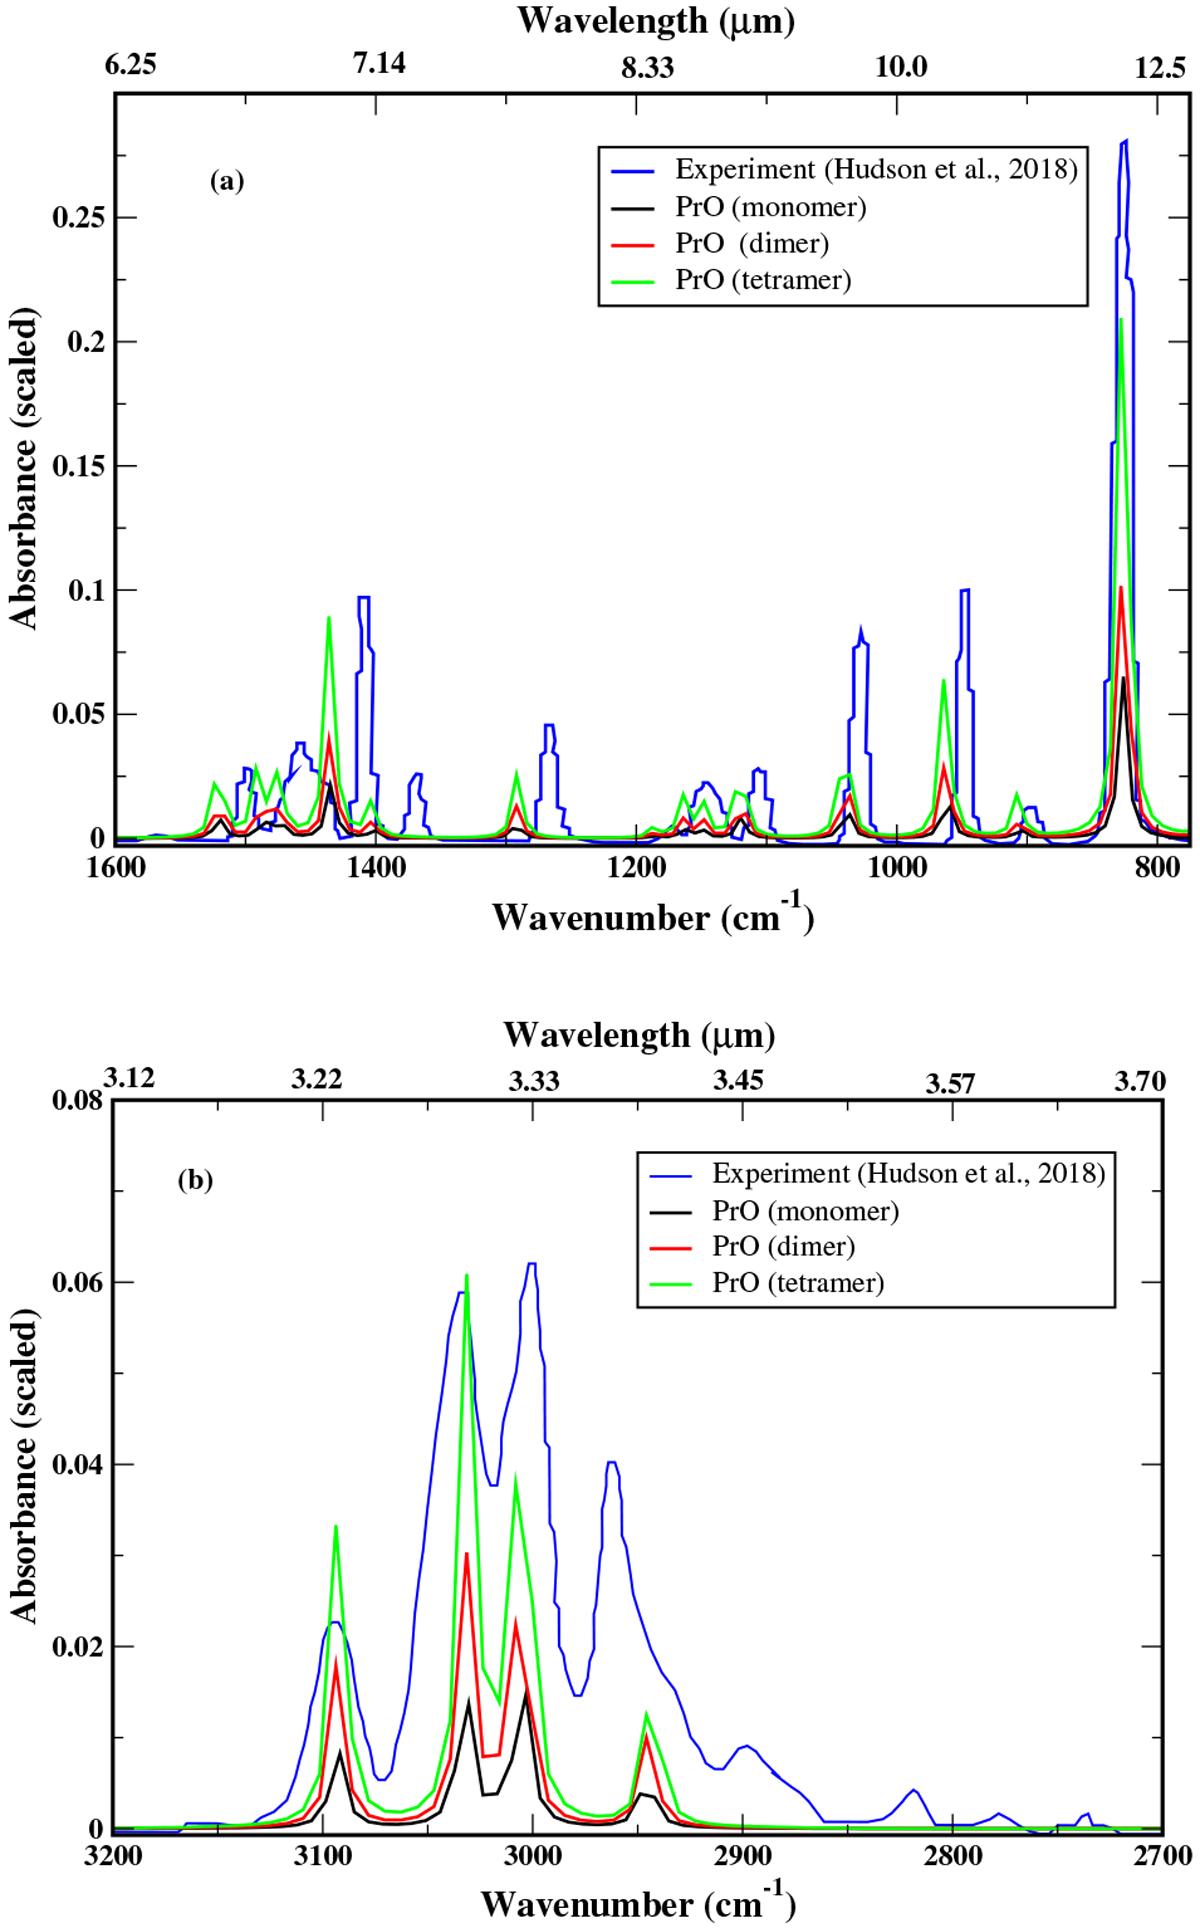
Comparison between our calculated spectra with those obtained in the experiment (Hudson et al. 2017). The results of Hudson et al. (2017) have been digitally extracted using https://apps.automeris.io/wpd. Upper panel: the mid-IR region. Lower panel: the near-IR region. For the sake of better visualization, we scaled down the Y-axis of our calculated values in (a) and (b). Our calculated wavenumber in the X-axis of (b) is scaled by 0.9728 to have better agreement.
Current usage metrics show cumulative count of Article Views (full-text article views including HTML views, PDF and ePub downloads, according to the available data) and Abstracts Views on Vision4Press platform.
Data correspond to usage on the plateform after 2015. The current usage metrics is available 48-96 hours after online publication and is updated daily on week days.
Initial download of the metrics may take a while.