Fig. 4
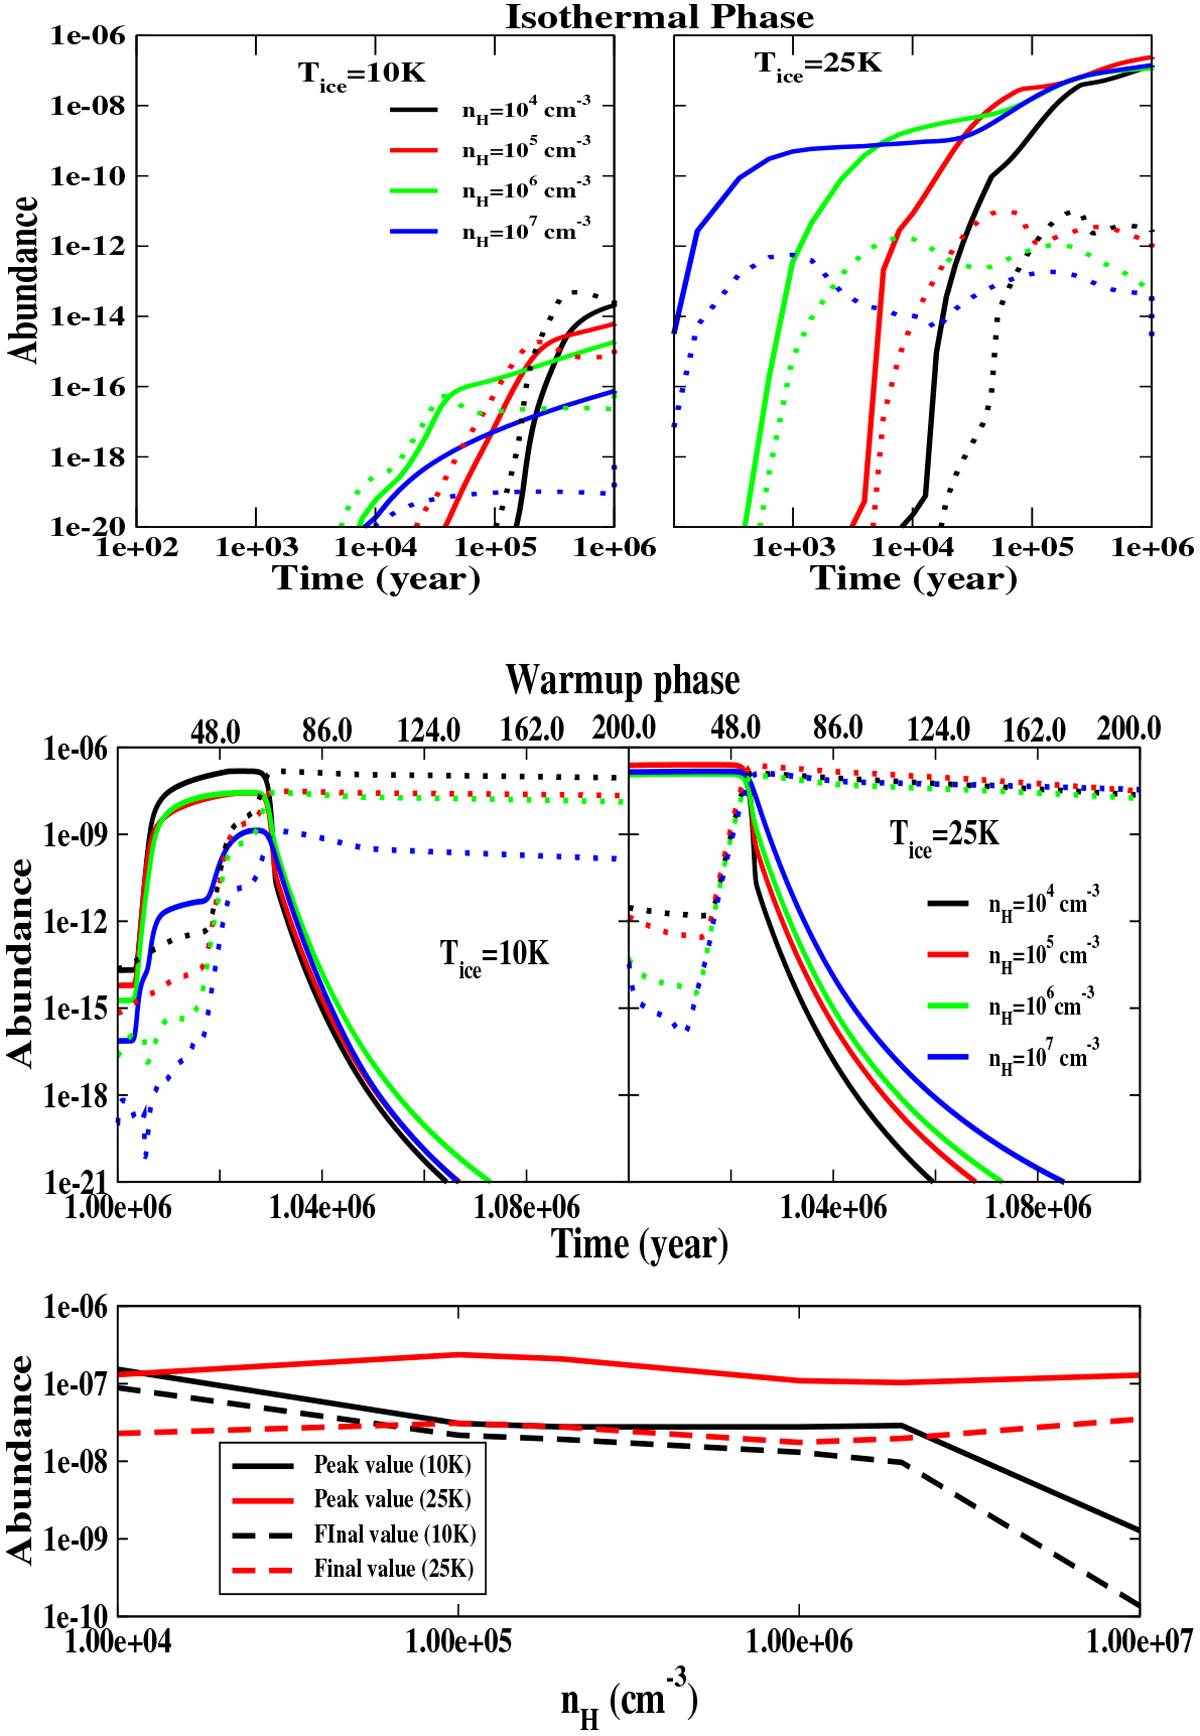
Chemical evolution of PrO in a two-phase model by considering various cloud densities. The upper two panels indicate the isothermal phase, the middle two panels indicate the warm-up, and the lower panel is for the gas phase peak abundance of PrO and final abundance of PrO at the warm-up phase for various density cloud. Different colors denote different cloud densities. In the upper and middle panels, the solid line represents the abundance in the gas phase whereas the dotted line represents the abundance in ice phase.
Current usage metrics show cumulative count of Article Views (full-text article views including HTML views, PDF and ePub downloads, according to the available data) and Abstracts Views on Vision4Press platform.
Data correspond to usage on the plateform after 2015. The current usage metrics is available 48-96 hours after online publication and is updated daily on week days.
Initial download of the metrics may take a while.