Fig. 9.
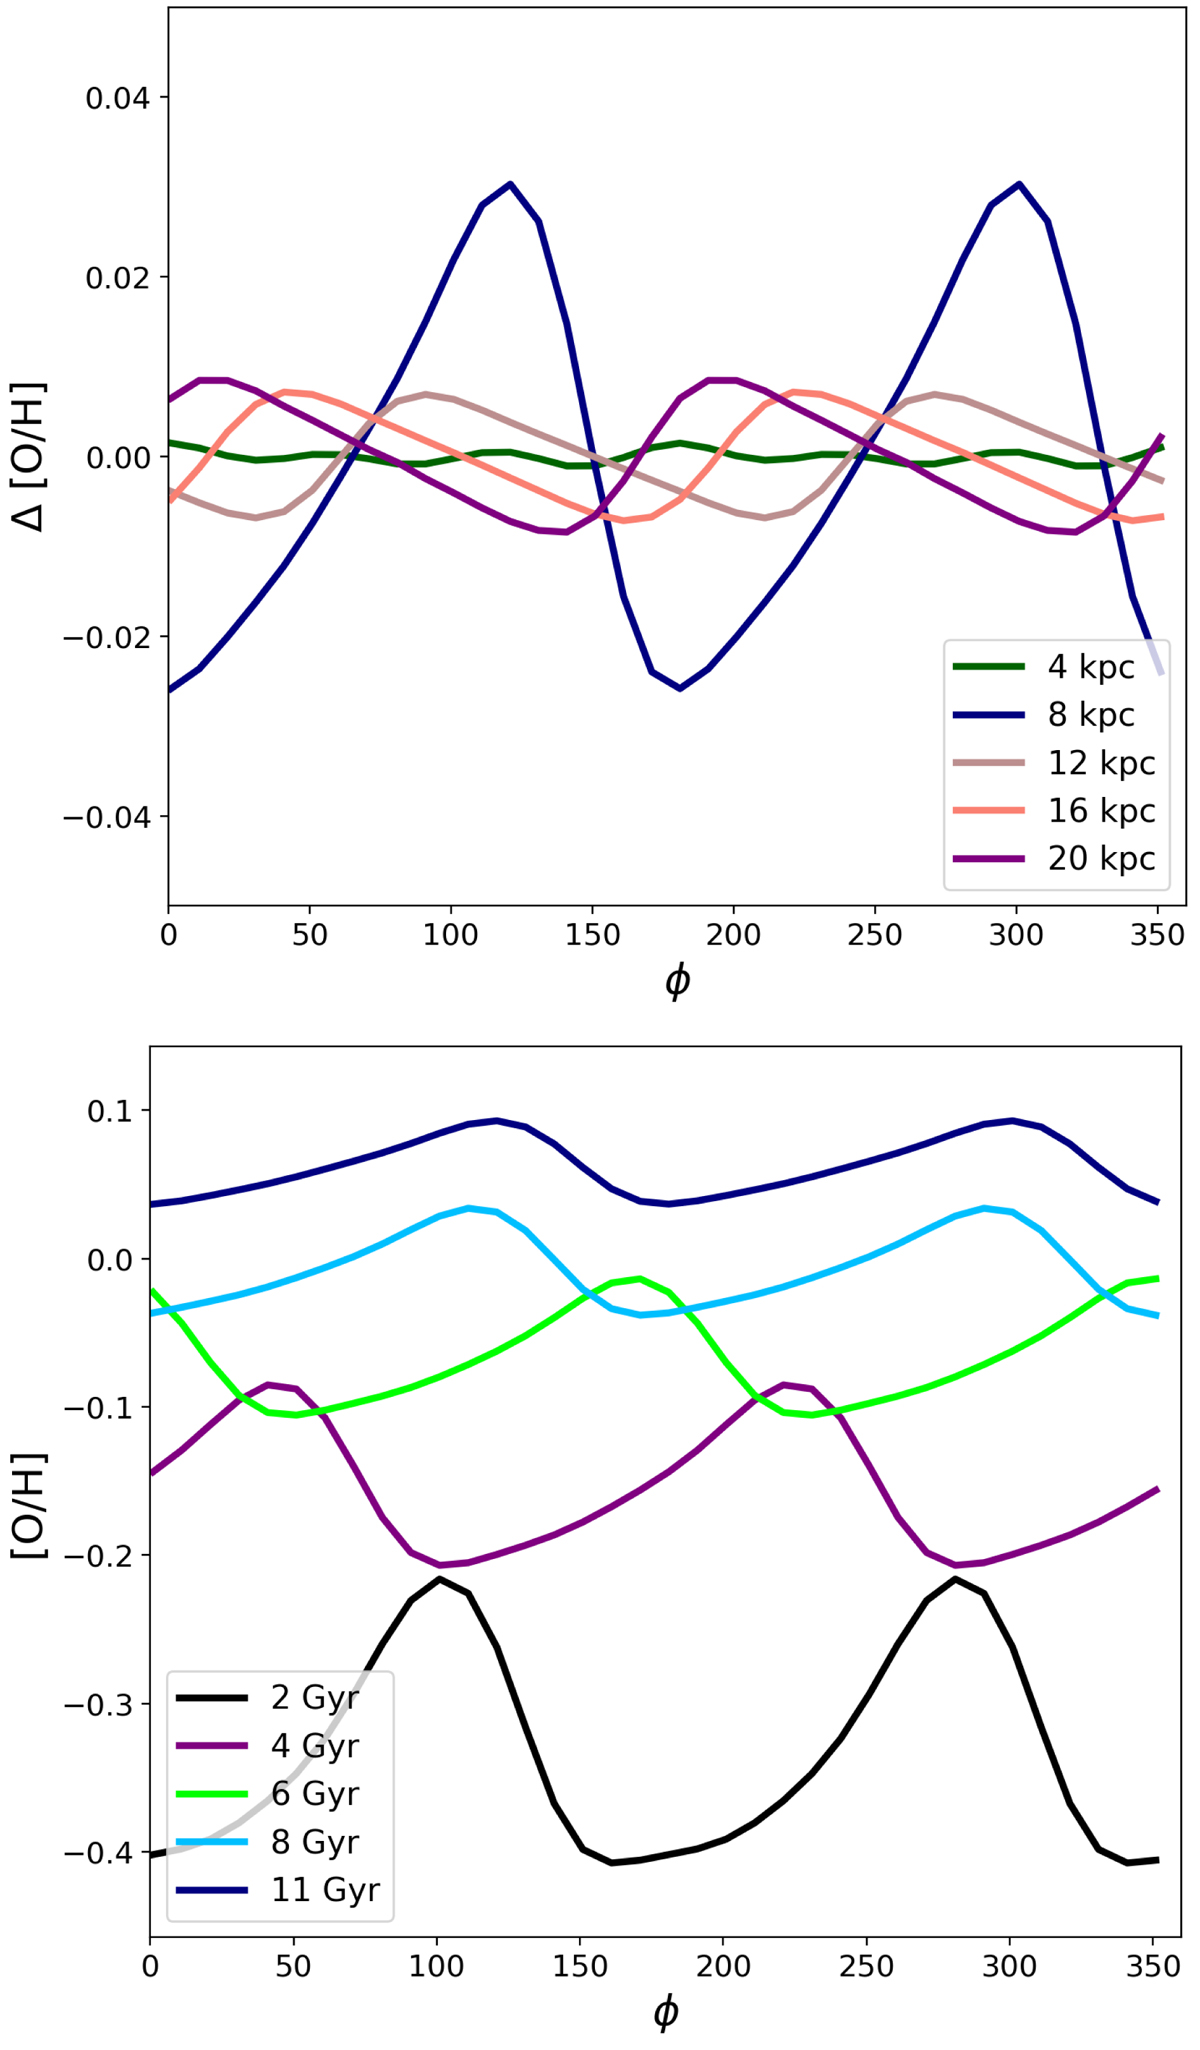
Results for the chemical evolution model in which we consider the density fluctuation associated with the analytical spiral arm formulation. Upper panel: azimuthal distribution of the residual of the oxygen abundances computed with our chemical evolution model at 4, 8, 12, 16, and 20 kpc (after subtracting the average radial gradient for a model with RS = 7, RD = 3.5, Σ0 = 20, ν = 1.1, Ωs = 20 km s−1 kpc−1, and m = 2 spiral arm; model S2A in Table 1). Lower panel: time evolution of the [O/H] abundance as a function of the azimuthal co-ordinate computed at 8 kpc.
Current usage metrics show cumulative count of Article Views (full-text article views including HTML views, PDF and ePub downloads, according to the available data) and Abstracts Views on Vision4Press platform.
Data correspond to usage on the plateform after 2015. The current usage metrics is available 48-96 hours after online publication and is updated daily on week days.
Initial download of the metrics may take a while.