Fig. 5.
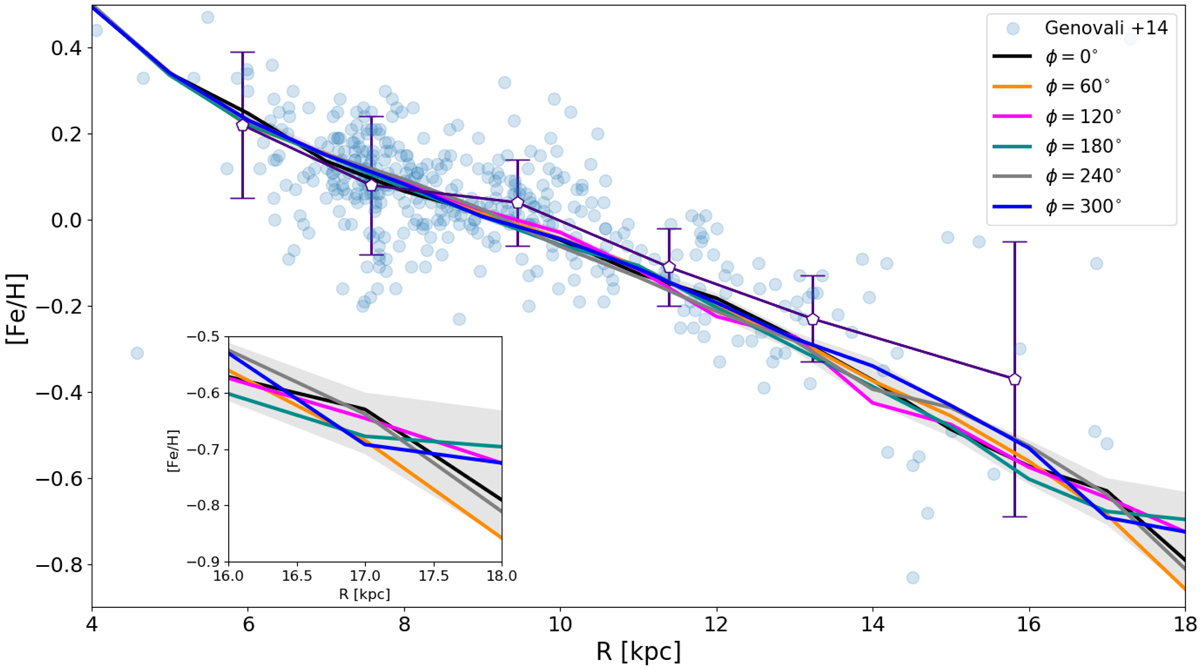
Results for the chemical evolution model in which we consider the density fluctuation by the chemo-dynamical model by MCM13. The present day Fe abundance gradient computed at different azimuthal co-ordinates. The shaded grey area limits are related to the maximum and minimum iron abundance values at the different Galactocentric distances. Observational data (light blue circles) are the Cepheids collected by Genovali et al. (2014). With the empty pentagons we report the average abundance values and relative errors of Genovali et al. (2014) when divided into six radial bins. In the zoomed region are presented the model lines computed between 16 and 18 kpc.
Current usage metrics show cumulative count of Article Views (full-text article views including HTML views, PDF and ePub downloads, according to the available data) and Abstracts Views on Vision4Press platform.
Data correspond to usage on the plateform after 2015. The current usage metrics is available 48-96 hours after online publication and is updated daily on week days.
Initial download of the metrics may take a while.