| Issue |
A&A
Volume 628, August 2019
|
|
|---|---|---|
| Article Number | A128 | |
| Number of page(s) | 5 | |
| Section | Planets and planetary systems | |
| DOI | https://doi.org/10.1051/0004-6361/201833960 | |
| Published online | 20 August 2019 | |
First observations of an outbursting comet with the MUSE integral-field spectrograph
European Southern Observatory,
Alonso de Cordova 3107,
Vitacura,
Santiago,
Chile
e-mail: This email address is being protected from spambots. You need JavaScript enabled to view it.
Received:
25
July
2018
Accepted:
28
May
2019
Abstract
We present the first observations of outbursting comet C/2015 ER61 (PANSTARRS) with the Multi-Unit Spectroscopic Explorer (MUSE). The comet was observed on April 9, 2017, only five days after it underwent a significant outburst during which the total brightness increased by a factor of ~7.5. Based on the MUSE observations, we produce simultaneous maps of the CN, C2, NH2 comae, and the dust coma. In turn, we applied image enhancement techniques in order to reveal features in the coma. By comparing the coma morphology for the dust and CN, C2, and NH2, we investigate the release mechanism of those gas species in the coma of comet ER61. We present evidence that NH2 could be released by icy or organic-rich dust grains.
Key words: comets: individual: C/2016 ER61 (PANSTARRS)
© ESO 2019
1 Introduction
This paper reports on the observations of the outbursting comet C/2015 ER61 (PANSTARRS) (hereafter ER61) with the MUSE instrument at the VLT. MUSE (Bacon et al. 2010) is a multi-unit integral field spectrograph mounted on the Nasmyth B focus of the 8-m VLT UT4 telescope. With its large field of view of 1′ × 1′, sampled with a spatial resolution of 0.2′′ without gaps, MUSE is an ideal instrument to study extended sources. The full 1′ × 1′ field of view is split into 24 slices, which are each sent to a separate IFU. Each slice is then further split into 48 15′′ × 0.2′′ mini slits. MUSE benefits from a large wavelength coverage, from 4800 to 9300 Å, and a resolving power about 3000. Observations of comets using IFUs have already been performed in the past (Dorman et al. 2013; Vaughan et al. 2017), but MUSE has the advantage of being attached to an 8-m telescope.
Cometary nuclei are believed to preserve important clues about the early solar nebula. However, their study is difficult since typical nuclei of comets are merely a few kilometers across and are often buried deeply inside comae, formed by the sublimation of cometary ices. From the ground, we can only obtain information about the nuclei indirectly via observing, for example, the morphological features of the comae. Various processes, such as rotation, the shape and obliquity of the nucleus, the presence of active regions and jets can all shape the appearance of a coma. By mapping the coma morphology, we are able to study the underlying processes that contribute to shaping those features and set constraints on the properties of the nucleus. The MUSE integral-field spectrograph offers a moderately large field of view and high spatial resolution, that enable us to map weak morphological features of the dust and gas coma simultaneously, without the limitations of narrow-band filters or long-slit spectroscopy.
MUSE was previously used to observe comet 67P/ Churyumov-Gerasimenko, the target of the Rosetta mission. However, only the dust coma, without obvious gas emission, was detected around 67P (Guilbert-Lepoutre et al. 2016). The observations of ER61 presented here are the first time that the gas coma of a comet has been detected and mapped by MUSE. ER61 is a long-period comet that was discovered on March 15, 2015 by the PANSTARRS survey and reached perihelion on May 10, 2017. As shown by Meech et al. (2017), the comet was already active in June 2015, at more than 7 au from the Sun. On April 4, 2017 the comet was reported to be in outburst by amateur astronomers (see, for example, Sekanina 2017). Following this event, it was observed by numerous telescopes around the world at a variety of wavelengths (see e.g. Yang et al. 2018).
2 Observations and data reduction
Our observations were performed shortly after the outburst, on April 9, 2017. Those MUSE observations are composed of four 300 s exposures on the target. No sky exposures were obtained. At that time, the comet was at 1.16 au from the Sun and 1.19 au from the Earth, and observed at a phase angle of 50°. For the first two exposures, the comet was not centred in the field of view, but was re-centred for the following two. The basic data reduction (dark subtraction, flat-fielding, and cube reconstruction) was performed using the ESO pipeline (Weilbacher et al. 2016). For all the exposures, the comet filled the entire field of view and the sky background could not be reliably estimated using uncontaminated areas. Given that the main goal of this work is to study coma morphology and that a uniform sky has very little impacton the coma features, we did not apply sky subtraction using the pipeline. The data cubes were flux calibrated using observations of a spectro-photometric standard star taken right after the comet observations.
In Fig. 1, we show an example of the spectrum of comet ER61 for one of the cubes, extracted over a 20 pixels radius (about 4′′) centred on the comet. In this spectrum, on top of the dust continuum, we detect multiple emission bands corresponding to several gas species. In the 4760–6760 Å region, we detect several bands of the C2 Swan system (mainly the Δν = 0 and Δν = −1 bands). We also clearly detect the (1–0) band of the CN red system around 9170 Å. NH2 emission lines are visible over a large portion of the red part of cometary spectra (Cochran & Cochran 2002). We mainly detect emission lines from the A–X (0,4,0)–(0,0,0) and A–X (0,3,0)–(0,0,0) bands. Faint lines of the X–X (0,12,0)–(0,0,0) band might also be present.
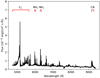 |
Fig. 1 Full spectrum of comet C/2015 ER61 (PANSTARRS) extracted from one 5 min exposure over 20 pixels radius centred on comet. The main gas species detected are indicated above the spectrum. It should be noted that since no sky subtraction was performed, some sky lines are also present, in addition to the cometary emission. |
3 Data cube extraction and analysis
One of the main advantages of using MUSE to observe comets is the capability to simultaneously study the spatial distribution of the dust and various gas species in the coma of comets. We collapsed our reduced data cube along defined wavelengths ranges to produce maps of the distribution of the dust and the C2, CN, and NH2 molecules inthe coma of ER61. In order to produce dust maps, we collapsed the four data cubes over the 7080–7120 Å wavelength range, which is mostly free of cometary gas and sky emission lines (close to the bandpass of the red continuum RC narrow-band filter of the cometary HB set defined in Farnham et al. 2000).
For the gas species, we needed to subtract the dust component first. We used previous observations of comet 67P obtained in March 2016 using MUSE with the same set-up as our ER61 observations. Since no cometary gas emission was detected in the MUSE observations of this comet, we used the spectrum of 67P as a proxy for the dust continuum. Given that the slope of the dust continuum can vary from comet to comet, the slope of 67P’s continuum was corrected to match that of ER61. Then, for each spaxel of the ER61 data cube, we scaled the reference dust spectrum and subtracted it from the spectrum of ER61. We produced spatial distribution maps of the gas by collapsing the dust subtracted cubes over the brightest part of the C2, CN, and NH2 emission bands: 5075–5168 Å for the C2; 9137–9207 Å for the CN; and over four NH2 groups of lines located around 5978, 5995, 6021, and 6335 Å. Those wavelength ranges, as well as the resulting spatial distribution maps are illustrated in Fig. 2.
We applied image enhancement techniques to our maps of the spatial distribution of the dust, C2, CN, and NH2 to search for morphological features in the coma. We used the web-based interface Cometary Coma Image Enhancement Facility1 (Samarasinha et al. 2013). For each species, we tested several image enhancement techniques, such as division by an azimuthal average, division by an azimuthal median, or azimuthal re-normalisation. We do not see a significant difference between the resulting maps produced using those different techniques. Examples of the resulting images obtained after division by an azimuthal median are shown in Fig. 2. The rectangular pattern in the background of the images is produced by vignetting of the field splitter and inter-stack vignetting (see the MUSE user manual for more information). This can usually be reduced by rotating the detector by +90, +180 or +270 degrees between exposures, which was not applicable in our case.
4 Results and discussion
The spatial maps shown in the center column of Fig. 2 indicate that the dust and the gas comae exhibit different morphologies. While the dust coma is extended in the anti-sunward direction, the gas coma is extended roughly perpendicular to the Sun-comet line. The enhanced map of dust shows more clearly that the dust coma is mostly enhanced in the anti-solar direction, with a dust jet almost coinciding with that direction. On the contrary, both the C2 and CN maps display an hourglass shape, with two broad jets in opposite directions. The NH2 morphology is noticeably different from the other two gas species. While we still see two broad jets, these do not have the same orientation as the C2 and CN features, and the coma brightness is clearly enhanced in the anti-solar direction.
Morphological features are observed in the coma of most active comets, even though the type and shape of features vary from one comet to another. It is generally thought that these features are produced by a non-uniformly active nucleus, with preferential active areas.Observing different morphologies for gas and dust species, as in the case of ER61, is not unusual. This was for example observed in the coma of comet C/2013 R1 (Lovejoy) (Opitom et al. 2015) and 103P/Hartley 2 (Knight & Schleicher 2013). Morphological differences between gas species or between gas and dust in the coma of comets are thought to be linked to compositional inhomogeneities at the surface of the nucleus. Surface inhomogeneities, with active regions dominated by the sublimation of different species were indeed observed in situ for comet 103P/Hartley 2 by the EPOXI spacecraft (A’Hearn et al. 2011).
The similarity of the CN and C2 morphology indicates that those two species might be released from the same source region. The fact that the NH2 morphology is different might then suggest a different release mechanism for this species. Especially, as NH2 is mainly enhanced towards the tail-ward hemisphere, this suggests that it could be released through icy or organic-rich grains pushed in the anti-sunward direction by the solar radiation pressure, as was hypothesised for comet 103P/Hartley 2 (Knight & Schleicher 2013). NH2 is of special importance because it is thought to be the product of the photo-dissociation of ammonia, one of the main reservoirs of nitrogen in comet nuclei. While ammonia can be observed in the radio or the near-infrared wavelengths, it is much more challenging to observe ammonia at longer wavelengths as compared to observing NH2 in the optical. If we assume that all the NH2 in the coma is solely produced by photo-dissociation of ammonia, then NH2 can serve as an easy proxy for studying ammonia abundance in comets. The NH2 optical bands have been observed in numerous comets through low- and high-resolution spectroscopy or even using narrow-band filters, but the MUSE IFU provides a unique opportunity to study its spatial distribution in the coma simultaneously with the distribution of other gas species and the dust.
We further examined whether the dust continuum removal technique using the spectrum of 67P could influence the gas features described above. We applied the same image enhancement technique to the gas maps without dust subtraction as a test. For CN and C2, the region adjacent to the nucleus of the processed map is dominated by the anti-sunward structure, which is similar to the dust feature. However, the hourglass-like shape is clearly visible at larger nucleocentric distances. Therefore, we are confident that the hourglass shape is not introduced by removing the dust component. Unfortunately, due to the lower signal-to-noise ratio (S/N), the two broad jets shown in Fig. 2 are not prominent in the non-dust subtracted maps of NH2. However, since the hourglass structure is not an artefact introduced by the dust subtraction method for CN and C2, it is unlikely that the structures observed in the NH2 map are caused by the dust removal. In addition, we note that since the division by an azimuthal median removes features that are symmetric at a given nucleocentric distance, a different color gradient with the nucleocentric distance in 67P as compared to ER61 should not influence the observed gas morphology. Furthermore, in order to make sure that the NH2 anti-sunward enhancement is not an artefact of the lower S/N in the NH2 maps, we looked at enhanced maps for all the data cubes, including the ones in which the comet is not well centred. In all of them, we observed the same morphology, as illustrated in Fig. 3 where the enhanced NH2 maps of the two centred observations are displayed side by side. We also looked separately at the four wavelength ranges summed up to obtain the NH2 map presented in Fig. 2 in order to disentangle the influence of different bands of NH2. Once again, they all show the same morphology and the same anti-sunward enhancement. Our various test results show that the NH2 morphology illustrated in Fig. 2 and described above is real, and not an artefact.
In order to further explore the possibility of NH2 being released from icy or organic-rich grains, we computed two median radial profiles of NH2 using the two NH2 maps in which the comet is roughly centred. We then fitted a Haser model (Haser 1957) to the observed NH2 radial profiles and derived the parent and daughter scale-lengths. The Haser model generally assumes that the dominant reaction producing NH2 in the coma is the following one: NH3 →NH2 + H, NH3 being the main parent of NH2. We obtained the best fit for parent scale-lengths of 4.8 × 10⁴ km and 5.7 × 10⁴ km for the two maps, and daughter scale-lengths of 1.5 × 10⁵ and 1.2 × 10⁵ km, respectively. One of the NH2 radial profiles, together with our best-fit model, is shown in Fig. 4. We also divided one of the maps in four quadrants, computed the radial profiles, and fitted a Haser model for each quadrant. We found that parent scale-lengths vary between 1.6 × 10⁴ and 8.9 × 10⁴ km amongst the quadrants, the largest parent scale-length being obtained for the quadrant encompassing the anti-sunward direction. According to Huebner et al. (1992), the NH3 lifetime for the NH3 →NH2 + H reaction at 1au from the Sun varies between 5.2 × 10³ and 5.8 × 10³ s depending on the solar activity. If we consider a gas velocity of 1 km s−1 (as adoptedin our Haser model), this corresponds to scale-lengths between 5.2 × 10³ and 5.8 × 10³ km. Those values are about one order of magnitude smaller than the ones we derive for the NH2 parent in the coma of ER61. This indicates that the observed NH2 is not produced (or at least not mostly produced) by the photo-dissociation of NH3 directly sublimated from the nucleus. Several measurements of the NH2 parent scale-length have been previously performed with various results. For example, Fink et al. (1991) and Korsun & Jockers (2002) report NH2 parent scale-lengths consistent with the photo-dissociation of NH3, while Delsemme & Combi (1983) report a much larger value. Beer et al. (2006) studied the contribution of icy grains to the activity of comets. They have shown that pure micron-sized icy grains (small enough to be pushed in the anti-sunward direction by the solar radiation) can have a lifetime of up to 105 s in the coma of a comet, even at heliocentric distances of about 1 au. Small, icy grains have been detected in the coma of comets 103P/Hartley 2, 9P/Tempel 1 (Protopapa et al. 2014; Schulz et al. 2006), and outbursting comet 17P/Holmes (Yang et al. 2009). Long-lived icy or organic-rich grains concentrated along the anti-sunward direction could be a significant source of NH2 in the coma of ER61. This is consistent with the larger parent scale-lengths measured in the anti-Solar direction and the observed morphology of NH2. Although the proposed mechanism in which NH2 is produced from an extended source can explain the anti-sunward enhancement of this molecule, dedicated modelling is needed to confirm its origin, which is beyond the scope of this paper.
In addition to the gas coma, we studied the dust properties as a function of the distance to the nucleus. We created two supplementary maps of the dust distribution, around 5280 Å (the bluer part of the spectrum) and 8620 Å (the redder part of the spectrum). From those, we produced a map of the dust-normalised reflectivity gradients, or “dust color” as defined by Jewitt & Meech (1986). In order to assess potential shifts between wavelengths due to atmospheric dispersion or guiding issues, we tested the alignment of the dust maps and found it to be better than 1 pixel. The resulting map of the dust color is shown in Fig. 5 where we can see that the dust becomes bluer when further from the nucleus. A common result of the particle size sorting should lead to a coma with larger particles dominating the inner coma and the smaller, fast-moving particles populating the outer coma, such that the inner coma should appear red with the outer coma being bluer. This is consistent with what we observe in the coma of comet ER61.
The observations presented in this paper are simply a quick snapshot of comet ER61 in non-ideal conditions but they already demonstrate the power of MUSE to study the spatial distribution of daughter species, and especially NH2. Combining observations of daughter species in the coma with MUSE with observations of their potential parents through the Atacama Large Millimeter/submillimeter Array, for example, could help solve the long-debated question of species parentage in the coma of comets. Applying a more appropriate observing strategy will increase even more the scientific return of comet observations with MUSE. For future observations of comets with MUSE, we would advise taking at least three exposures with a small dithering and a 90° rotation between each exposure in order to first average out cosmic rays and background stars crossing the field, and second to improve the IFU-to-IFU background uniformity in the combined data cube. We also recommend obtaining dedicated exposures of the sky offset from the comet position in between the science exposures in order to allow a clean subtraction of the sky contribution, as well as observations of a solar analogue to perform the dust continuum subtraction.
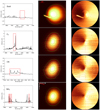 |
Fig. 2 Spatial distribution maps of gas and dust. Left: zoomed spectra of ER61 showing in red boxes the wavelength ranges used to produce the dust, C2, CN, and NH2 spatial distribution maps (from top to bottom). Centre: maps of the dust, C2, CN, and NH2 spatial distribution built using a single data cube. We drew contours to guide the eye. Right: maps of the dust, C2, CN, and NH2 spatial distribution after division by an azimuthal median. The images are oriented with the south at the bottom and the west to the right. The red arrow indicates the anti-sunward direction. The bright trail in the dust maps is a star trail. |
 |
Fig. 3 Comparison of NH2 morphology in two centred exposures, after division by azimuthal median. The images are oriented with the north at the top and the east to the left. |
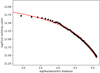 |
Fig. 4 NH2 radial profile (black dots) overlaid with best-fit Haser model (red curve). |
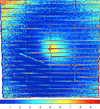 |
Fig. 5 Map of dust color in coma of comet ER61 (1′ × 1′ FoV). The dust color is expressed in units of percentage per 103 Å. The image is oriented with the north at the top and the east to the left. |
5 Conclusions
In this paper, we present observations that demonstrate the power of MUSE in simultaneously studying the spatial distribution of multiple gaseous species in the coma of a comet. We found the morphology of the dust to be different from that of the gas species (CN, C2, NH2) in the coma. The morphology of NH2 shows significant enhancement in the anti-sunward direction as compared to other gas species, indicating that NH2 could be released from an extended source, such as icy or organic-rich grains. The extended source scenario could also explain the shape of the radial profile of NH2, whose Haser model parent lifetime is inconsistent with NH3 released from the nucleus being the primary parent. Finally, we found that the dust coma appears bluer at larger nucleocentric distances, consistent with the expected natural size sorting of the particles in the coma of comets.
Acknowledgements
These findings are based on observations made with ESO Telescopes at the La Silla Paranal Observatory under programme 60.A-9800(T).
References
- A’Hearn, M. F., Belton, M. J. S., Delamere, W. A., et al. 2011, Science, 332, 1396 [NASA ADS] [CrossRef] [Google Scholar]
- Bacon, R., Accardo, M., Adjali, L., et al. 2010, Proc. SPIE, 7735, 773508 [Google Scholar]
- Beer, E. H., Podolak, M., & Prialnik, D. 2006, Icarus, 180, 473 [NASA ADS] [CrossRef] [Google Scholar]
- Cochran, A. L., & Cochran, W. D. 2002, Icarus, 157, 297 [NASA ADS] [CrossRef] [Google Scholar]
- Delsemme, A. H., & Combi, M. R. 1983, ApJ, 271, 388 [NASA ADS] [CrossRef] [Google Scholar]
- Dorman, G., Pierce, D. M., & Cochran, A. L. 2013, ApJ, 778, 140 [NASA ADS] [CrossRef] [Google Scholar]
- Farnham, T. L., Schleicher, D. G., & A’Hearn, M. F. 2000, Icarus, 147, 180 [NASA ADS] [CrossRef] [Google Scholar]
- Fink, U., Combi, M. R., & Disanti, M. A. 1991, ApJ, 383, 356 [NASA ADS] [CrossRef] [Google Scholar]
- Guilbert-Lepoutre, A., Besse, S., Snodgrass, C., & Yang, B. 2016, AAS/Division for Planetary Sciences Meeting Abstracts, 48, 116.12 [NASA ADS] [Google Scholar]
- Haser, L. 1957, Bull. Soc. Roy. Sci. Liége, 43, 740 [Google Scholar]
- Huebner, W. F., Keady, J. J., & Lyon, S. P. 1992, Ap&SS, 195, 1 [NASA ADS] [CrossRef] [Google Scholar]
- Jewitt, D., & Meech, K. J. 1986, ApJ, 310, 937 [NASA ADS] [CrossRef] [Google Scholar]
- Knight, M. M., & Schleicher, D. G. 2013, Icarus, 222, 691 [NASA ADS] [CrossRef] [Google Scholar]
- Korsun, P. P., & Jockers, K. 2002, A&A, 381, 703 [NASA ADS] [CrossRef] [EDP Sciences] [Google Scholar]
- Meech, K. J., Schambeau, C. A., Sorli, K., et al. 2017, AJ, 153, 206 [NASA ADS] [CrossRef] [Google Scholar]
- Opitom, C., Jehin, E., Manfroid, J., et al. 2015, A&A, 584, A121 [NASA ADS] [CrossRef] [EDP Sciences] [Google Scholar]
- Protopapa, S., Sunshine, J. M., Feaga, L. M., et al. 2014, Icarus, 238, 191 [NASA ADS] [CrossRef] [Google Scholar]
- Samarasinha, N. H., Martin, M. P., & Larson, S. M. 2013, Cometary Coma Image Enhancement Facility [Google Scholar]
- Schulz, R., Owens, A., Rodriguez-Pascual, P. M., et al. 2006, A&A, 448, L53 [NASA ADS] [CrossRef] [EDP Sciences] [Google Scholar]
- Sekanina, Z. 2017, ArXiv e-prints [arXiv:1712.03197] [Google Scholar]
- Vaughan, C. M., Pierce, D. M., & Cochran, A. L. 2017, AJ, 154, 219 [NASA ADS] [CrossRef] [Google Scholar]
- Weilbacher, P. M., Streicher, O., & Palsa, R. 2016, Astrophysics Source Code Library [record ascl:1610.004] [Google Scholar]
- Yang, B., Jewitt, D., & Bus, S. J. 2009, AJ, 137, 4538 [NASA ADS] [CrossRef] [Google Scholar]
- Yang, B., Hutsemékers, D., Shinnaka, Y., et al. 2018, A&A, 609, L4 [NASA ADS] [CrossRef] [EDP Sciences] [Google Scholar]
All Figures
|
Fig. 1 Full spectrum of comet C/2015 ER61 (PANSTARRS) extracted from one 5 min exposure over 20 pixels radius centred on comet. The main gas species detected are indicated above the spectrum. It should be noted that since no sky subtraction was performed, some sky lines are also present, in addition to the cometary emission. |
| In the text | |
|
Fig. 2 Spatial distribution maps of gas and dust. Left: zoomed spectra of ER61 showing in red boxes the wavelength ranges used to produce the dust, C2, CN, and NH2 spatial distribution maps (from top to bottom). Centre: maps of the dust, C2, CN, and NH2 spatial distribution built using a single data cube. We drew contours to guide the eye. Right: maps of the dust, C2, CN, and NH2 spatial distribution after division by an azimuthal median. The images are oriented with the south at the bottom and the west to the right. The red arrow indicates the anti-sunward direction. The bright trail in the dust maps is a star trail. |
| In the text | |
|
Fig. 3 Comparison of NH2 morphology in two centred exposures, after division by azimuthal median. The images are oriented with the north at the top and the east to the left. |
| In the text | |
|
Fig. 4 NH2 radial profile (black dots) overlaid with best-fit Haser model (red curve). |
| In the text | |
|
Fig. 5 Map of dust color in coma of comet ER61 (1′ × 1′ FoV). The dust color is expressed in units of percentage per 103 Å. The image is oriented with the north at the top and the east to the left. |
| In the text | |
Current usage metrics show cumulative count of Article Views (full-text article views including HTML views, PDF and ePub downloads, according to the available data) and Abstracts Views on Vision4Press platform.
Data correspond to usage on the plateform after 2015. The current usage metrics is available 48-96 hours after online publication and is updated daily on week days.
Initial download of the metrics may take a while.