Fig. 2
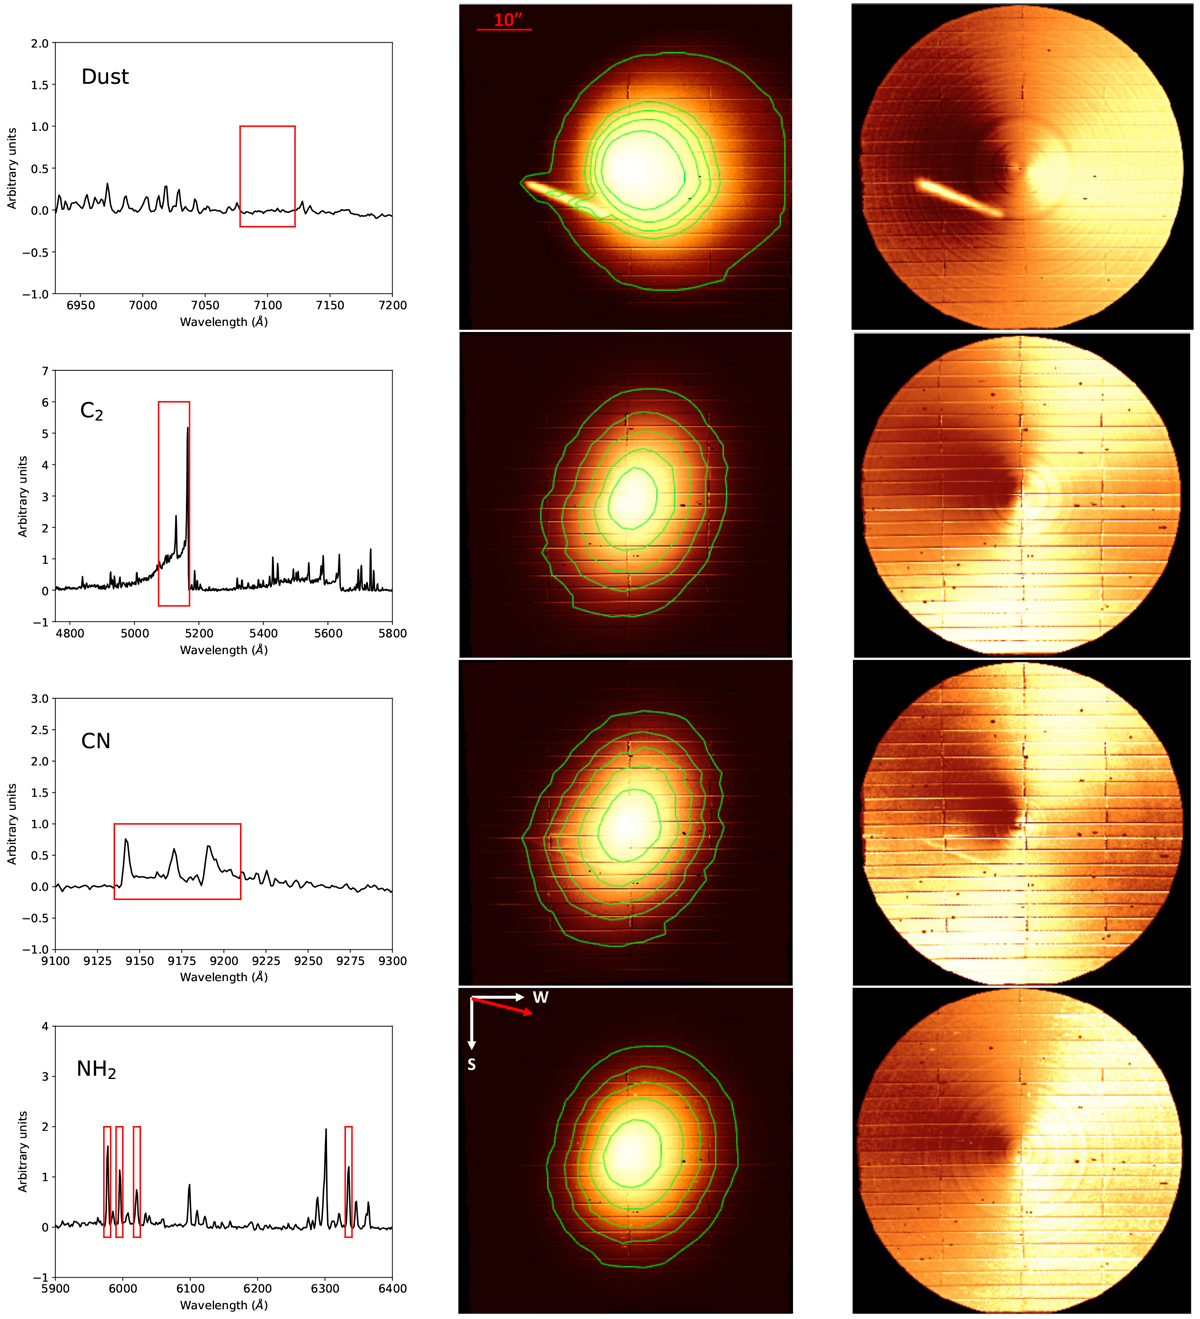
Spatial distribution maps of gas and dust. Left: zoomed spectra of ER61 showing in red boxes the wavelength ranges used to produce the dust, C2, CN, and NH2 spatial distribution maps (from top to bottom). Centre: maps of the dust, C2, CN, and NH2 spatial distribution built using a single data cube. We drew contours to guide the eye. Right: maps of the dust, C2, CN, and NH2 spatial distribution after division by an azimuthal median. The images are oriented with the south at the bottom and the west to the right. The red arrow indicates the anti-sunward direction. The bright trail in the dust maps is a star trail.
Current usage metrics show cumulative count of Article Views (full-text article views including HTML views, PDF and ePub downloads, according to the available data) and Abstracts Views on Vision4Press platform.
Data correspond to usage on the plateform after 2015. The current usage metrics is available 48-96 hours after online publication and is updated daily on week days.
Initial download of the metrics may take a while.