Fig. 2.
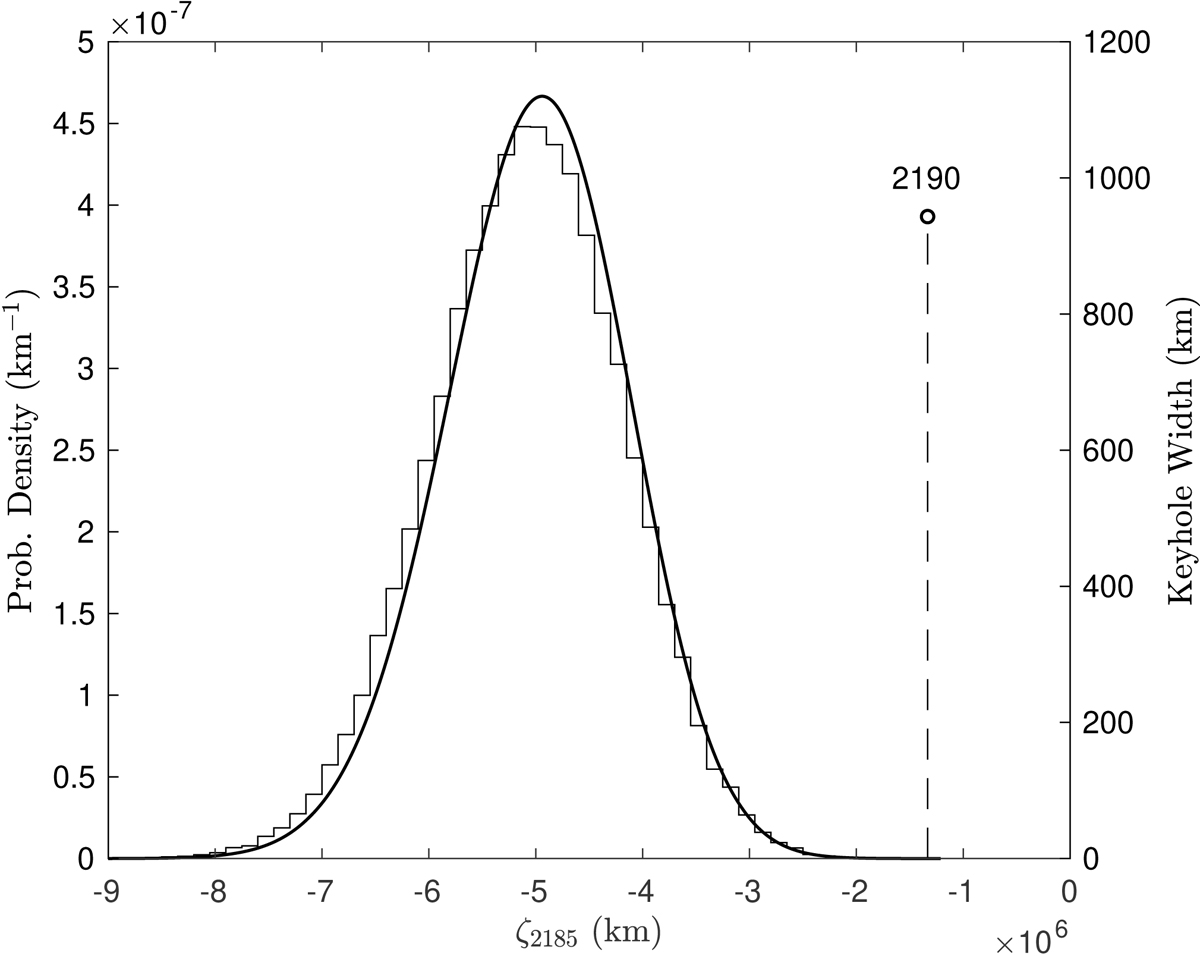
Graph of the NEODyS non-linear probability density function p(ζ) on the 2185 b-plane (bold curve), whose scale is reported on the left vertical axis. The 2190 keyhole is represented by the vertical line segment, which is located at the keyhole centre ζk = −1.333461 × 10⁶ km and whose height is equal to the width wk = 943 km, with the scale on the right vertical axis. The histogram represents the distribution based on the virtual asteroids of the first MLCS layer from JPL solution 100.
Current usage metrics show cumulative count of Article Views (full-text article views including HTML views, PDF and ePub downloads, according to the available data) and Abstracts Views on Vision4Press platform.
Data correspond to usage on the plateform after 2015. The current usage metrics is available 48-96 hours after online publication and is updated daily on week days.
Initial download of the metrics may take a while.