| Issue |
A&A
Volume 627, July 2019
|
|
|---|---|---|
| Article Number | L8 | |
| Number of page(s) | 4 | |
| Section | Letters to the Editor | |
| DOI | https://doi.org/10.1051/0004-6361/201935835 | |
| Published online | 12 July 2019 | |
Letter to the Editor
Masses of the Hyades white dwarfs
A gravitational redshift measurement⋆
1
ESO, Karl Schwarzschild Strasse 2, 85748 Garching, Germany
e-mail: lpasquin@eso.org
2
Zentrum für Astronomie der Universität Heidelberg, Landessternwarte, Königstuhl 12, 69117 Heidelberg, Germany
3
Departamento de Física, Universidade Federal do Rio Grande do Norte, 59078-970 Natal, RN, Brazil
4
Max-Planck-Institut für Astrophysik, Karl-Schwarzschild-Str. 1, 85748 Garching, Germany
Received:
3
May
2019
Accepted:
25
June
2019
Context. It is possible to accurately measure the masses of the white dwarfs (WDs) in the Hyades cluster using gravitational redshift, because the radial velocity of the stars can be obtained independently of spectroscopy from astrometry and the cluster has a low velocity dispersion.
Aims. We aim to obtain an accurate measurement of the Hyades WD masses by determining the mass-to-radius ratio (M/R) from the observed gravitational redshift, and to compare them with masses derived from other methods.
Methods. We analyse archive high-resolution UVES-VLT spectra of six WDs belonging to the Hyades to measure their Doppler shift, from which M/R is determined after subtracting the astrometric radial velocity. We estimate the radii using Gaia photometry as well as literature data.
Results. The M/R error associated to the gravitational redshift measurement is about 5%. The radii estimates, evaluated with different methods, are in very good agreement, though they can differ by up to 4% depending on the quality of the data. The masses based on gravitational redshift are systematically smaller than those derived from other methods, by a minimum of ∼0.02 up to 0.05 solar masses. While this difference is within our measurement uncertainty, the fact that it is systematic indicates a likely real discrepancy between the different methods.
Conclusions. We show that the M/R derived from gravitational redshift measurements is a powerful tool to determine the masses of the Hyades WDs and could reveal interesting properties of their atmospheres. The technique can be improved by using dedicated spectrographs, and can be extended to other clusters, making it unique in its ability to accurately and empirically determine the masses of WDs in open clusters. At the same time we prove that gravitational redshift in WDs agrees with the predictions of stellar evolution models to within a few percent.
Key words: white dwarfs / stars: fundamental parameters / open clusters and associations: individual: Hyades
© ESO 2019
1. Introduction
The importance of the accurate determination of stellar mass cannot be overemphasized. Especially for white dwarfs (WDs), the mass-to-radius relationship is interesting because it is accurately predicted by stellar physics and evolution, and unlike in other stages of stellar evolution, more massive stars are predicted to have smaller radii. The ratio between the initial stellar mass and the mass of WDs for instance is essential to model stellar populations, and more generally to verify predictions of stellar-evolution models such as cooling times, ages, and masses of WDs. A direct comparison between models and observations is therefore fundamental. For example, Salaris & Bedin (2018) use evolutionary models to estimate the masses of the Hyades WDs with a precision of about 2%. The radii and masses of WDs can be obtained by observing these targets in eclipsing binaries, to better than 1% accuracy (see e.g. Parsons et al. 2017). We think that it is now possible to observationally determine the masses of the Hyades WDs with good accuracy because (i) Gaia provides very accurate distances (to better than 0.5%) for these stars, and (ii) the Hyades cluster radial velocity is known with an uncertainty of about 100 ms−1 (Leão et al. 2019). These latter authors have also shown that spectroscopic and astrometric radial velocities agree to better than ∼30 ms−1 once the additional causes of line shifts are properly taken into account: gravitational redshift, atmospheric convective motions, and cluster rotation. After applying these corrections, the cluster velocity dispersion is small: less than 340 ms−1 (Leão et al. 2019). Therefore, in principle, by measuring the spectral Doppler shift of the WDs in the Hyades, their gravitational redshift (GR) can be derived with an error of ∼300 ms−1. In most stars the GR is of a few hundred metres per second, comparable to the convective blueshifts in stellar atmospheres (see e.g. Allende Prieto et al. 2002; Leão et al. 2019), but in WDs the GR signal is very pronounced (tens of km s−1), and, if hotter than ∼14 000 K, no other mechanism capable of shifting the lines of these stars is expected to be present (Allende Prieto et al. 2002; Tremblay et al. 2013). This implies that the difference between the spectroscopic Doppler shifts and the astrometric radial velocity can be attributed entirely to GR, making the measurement potentially very accurate.
White dwarf binaries are also suitable candidates for this technique, provided the binary system is very well characterised, and GR observations have been used with success for Sirius B to show the equivalence between the GR mass and dynamical mass of this star (Joyce et al. 2018).
The eight well-established DA WDs (white dwarfs with hydrogen atmospheres) belonging to the Hyades cluster (Salaris & Bedin 2018) are therefore ideal candidates for GR measurement.
2. Doppler shift and GR measurements
The spectral lines of WDs are very broad, and in principle this makes the measurement of their Doppler shift relatively difficult. However, the main Balmer lines (notably Hα and sometimes Hβ) show non- local thermodynamic equilibrium (LTE) narrow cores, allowing precise measurements of their Doppler shifts. This feature has been used in the past to measure GR or to search for binary progenitors of supernovae (see e.g. Reid 1996; Napiwotzki et al. 2001; Zuckerman et al. 2013).
Out of the eight classical DA WDs in the Hyades, six have been observed with UVES at the VLT in the early 2000s by the Supernova-Ia Progenitor Survey (SPY) large programme (Napiwotzki et al. 2001) and they are listed in Table 1. Each star has been observed at two different epochs. The signal to noise ratio (S/N) for each observation is about 25 in the continuum close to Hα. All the stars show a narrow non-LTE Hα core, and the combined error arising from the spectra S/N and the line core width translates into fit measurement errors between 0.8 and 1.5 km s−1. The two measurements per star are indeed consistent with these errors. The same spectra were previously analysed by Falcon et al. (2010), and a comparison between their Hα Doppler shift measurements and ours shows excellent agreement to within a few hundred metres per second for all stars. Since we are interested in absolute measurements we in addition consider that the spectra were obtained with a relatively wide slit (2 arcsec). This adds to the line fit uncertainty the error induced by centering the star in the slit, by a non-predictable amount (note that 1 km s−1 corresponds to a shift of less than 0.2 arcsec in the UVES slit, Pasquini et al. 2015). Finally, UVES is not in vacuum, nor is it thermally stabilised, and so shifts caused by variations of these environmental parameters are possible. The reduced data were taken from the UVES science data products in the VLT archive, and the measured Doppler velocities are provided in Table 1 (corrected to the solar system barycenter) as measured from the Hα core and averaging the two observations. The associated error is simply half the difference between the two UVES spectra. When adding the other sources of error, we consider that an overall uncertainty of 2 km s−1 is realistic. We assumed for Hα a wavelength of 6562.801 Å.
Gravitational redshift measurement.
The Doppler shifts were subsequently corrected for the astrometric radial velocity of each star and for the cluster rotation, though the latter is less than 300 ms−1 for the sample stars (Leão et al. 2019), providing the GR for each star. All the values obtained are given in Table 1.
In the same table we also provide the Doppler velocities measured by Zuckerman et al. (2013) and the GR measured by Reid (1996) with HIRES at Keck. These independent measurements agree well with ours, confirming that the assumed 2 km s−1 uncertainty is very reasonable. It is worth noting that Zuckerman et al. (2013) used the blue setup of HIRES, which does not provide access to Hα, and higher lines in the Balmer series were measured. These latter lines do not show narrow cores, explaining why their velocities have a comparable uncertainty to the UVES ones, in spite of the fact that the Keck spectra are at a higher resolution and have higher S/N ratios. Since other lines as well as another spectrograph were used, the Zuckerman et al. (2013) measurements are complementary and independent from ours. The maximum difference between the Zuckerman et al. (2013) Doppler shift and ours is of 3 km s−1, in agreement with our estimated uncertainty.
We finally compute M/R (in solar unit) by averaging the UVES and Zuckerman et al. (2013) shifts (also reported in Table 1) and using the formula: GR = 0.6365(M/R) (in km s−1). The M/R values are reported in the last column of Table 1. We expect an error of about 3 units in M/R, which translates into a 4−5% uncertainty.
3. The estimate of the radii
Once M/R has been measured, we need to estimate the stellar radii. Since the angular extension of the stars is too small for interferometric measurements, the most direct way of determining the stellar radii is to compute bolometric magnitudes and apply the definition of luminosity. Temperatures and stellar parameters can also be obtained by the spectral fitting of the Balmer lines and the global fitting of the spectra (hereafter “spectroscopic”, e.g. Tremblay et al. 2012; Gianninas et al. 2011). Following Salaris & Bedin (2018), we used Gaia colours and magnitudes, and the WD model atmospheres developed by Bergeron and collaborators (Holberg & Bergeron 2006; Kowalski & Saumon 2006; Tremblay et al. 2011) by interpolating the models for DA dwarfs and thin hydrogen atmospheres. Using the Gaia parallaxes, we computed the absolute magnitudes in the Gaia filter, G, GBP and GRP, and performed a fit to the synthetic magnitudes kindly provided by Dr. Bergeron. The best-fit model provides a measurement of the effective temperature (Teff) and the bolometric magnitude (Mbol) of each WD. Given the vicinity of the Hyades, we did not apply any reddening correction. Assuming the standard values for the Sun, T⊙ = 5780 K and Mbol⊙ = 4.75 mag, the radius of the WD can then be determined by combining the bolometric magnitude definition with the Stefan-Boltzmann law. The results are given in Table 2.
Stellar radii and masses.
Radii for these stars have been estimated, either from spectroscopy (e.g. Cummings et al. 2018, whose results are very similar to those of Tremblay et al. 2012), or from photometry, from either Gaia or the Sloan Digital Sky Survey (SDSS; Gentile Fusillo et al. 2019), and they are also reported in Table 2. The agreement between the radii estimates is good, but they may differ by up to 10% (peak to peak) for some of the stars. The two radii based on SDSS photometry by Gentile Fusillo et al. (2019) are systematically smaller than the other values, but we have no explanation for this (see also Bergeron et al. 2019). We have not used these values in our radii estimates.
For HZ4 and EGGR29 the agreement is excellent, independent of the diagnostic used. Since these two stars are spectrophotometric standards, we expect the quality of their photometry and spectroscopy to be superior. The excellent agreement indicates that the discrepancies likely reflect the quality of the input data.
Following the method described above, we also computed the WD radii, performing the photometric fit to the SED composed by the Johnson V magnitudes and B − V colours, the Gaia photometry, and the SDSS photometry, whenever available. The results are listed in column Rj + s + g of Table 2. For two stars this would produce larger radii by about 0.006 R⊙, while for the others the agreement with our average is excellent.
Gravitational redshift masses are given in Table 2, and they have been computed using the M/R ratios determined in the previous section and the radii computed by averaging the Gaia values from Gentile Fusillo et al. (2019; Col. 2), Cummings et al. (2018; Col. 6), and our Gaia values (Col. 8). We have not used the SED estimates (Col. 9) in making the average because they include the Gaia colours. The average is reported in Table 2 (Col. 10), together with the associated dispersion. We notice that this dispersion is not a realistic estimate of the uncertainty; the reason being that the radii estimates are not independent, since two are based on the same Gaia colours and all use the same family of model-based transformations. In addition, the results from Gentile Fusillo et al. (2019) and Cummings et al. (2018) implicitly use the mass-to-radius relationship of Fontaine et al. (2001).
In the determination of the GR mass, we estimate an uncertainty of about 0.03 M⊙ introduced by the error on the Doppler shift. The uncertainty on the radius is more difficult to evaluate, and the values in Table 2, obtained with different methods and colours, differ from a minimum of ∼1% for the most well-characterised stars to 4% for the most poorly characterised, not considering the SDSS-based estimate of Gentile Fusillo et al. (2019).
Bearing these uncertainties in mind, our GR masses are systematically smaller than those estimated by other authors.
A similar systematic shift is present for five stars when comparing our GR masses with those derived by Salaris & Bedin (2018), who claim an accuracy of ∼0.01 M⊙.
The uncertainty associated to our GR determination is too large to derive a firm conclusion, but it is unlikely that all our velocities are systematically too small. Furthermore, there is no evidence of a systematic effect when comparing our velocities with those obtained by other authors (see Table 1). Could the WDs in the Hyades have different kinematics from the rest of the Hyades stars? In their study of the WDs in the globular cluster NGC 6397, Davis et al. (2008) argue that asymmetric kicks could explain the peculiar kinematics of these stars, but these kicks should result in a larger velocity dispersion for this group of stars, not in a systematic effect. Effects, such as mass segregation are also expected to enhance the velocity dispersion rather than produce asymmetries, and Leão et al. (2019) find that the cluster radial velocity remains substantially unchanged when sampling with different radii.
Furthering our case in Fig. 1 we show two observational quantities, namely M/R as measured from GR and the absolute stellar G magnitude, with the associated error bars. For each star we computed the effective temperature averaging from the Gentile Fusillo et al. (2019) and the Cummings et al. (2018) values, and the tracks corresponding to these temperatures are also displayed, with the same colour as the star symbol. Clearly the observed points would agree with models systematically cooler than what was found. We can therefore safely conclude that our GR masses, although not of adequate accuracy, are lower than what has been found by other studies. While we can quantify the error in the Doppler shifts, the one in the radius is more difficult to estimate, because we have no control on the systematic effects in the models. The use of different techniques and data seem to produce differences of up to 0.001 R⊙, or 10% (peak to peak) in the worse case.
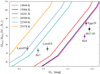 |
Fig. 1. Comparison between observations and models in an observational plane: M/R vs. GaiaG magnitudes. Each star is indicated with a different symbol and colour. For each star, its effective temperature has been computed as the average value between the measurements by Cummings et al. (2018) and Gentile Fusillo et al. (2019) and the corresponding models are over-imposed and colour-coded as the corresponding star. All stars lay below the corresponding curves, indicating a discrepancy between the adopted models and our observations. |
Romero et al. (2019) study the dependence of the WD parameters from the stellar atmospheres, finding that the radii of WDs decrease the smaller the content of hydrogen in their envelopes, by up to several percent for stars with masses and temperatures comparable to the Hyades WDs. If the mass of the H layer was smaller than the 10−4M⊙ adopted by both Cummings et al. (2018) and Gentile Fusillo et al. (2019), then their gravity would be systematically overestimated and consequently the masses derived would also be higher. It seems therefore quite possible that the discrepancy between these authors and our GR-based measurement is due to a lower-mass H envelope, but we feel that given the associated uncertainties, pushing such a hypothesis further is beyond the scope of this work.
4. Conclusions
The classical DA WDs in the Hyades cluster are hot enough to avoid complications from atmospheric effects (convective shifts). Moreover, since the cluster velocity is determined with high accuracy, and the equivalence between astrometric and spectroscopic radial velocities has been shown to better than 30 ms−1 for the Hyades stars, astrometric velocities can be directly subtracted from the measured Doppler shiftsPleas. This, coupled with the low internal velocity dispersion of the cluster, make them ideal candidates for measurement of their masses with GR.
We used archive VLT-UVES observations to measure the GR of six bona-fide Hyades WDs, showing that even if these observations were taken for other purposes, they can define the M/R ratio to within an accuracy of 5%.
We estimated the stellar radii using photometry and models, and we also used literature results, either based on photometry or on spectroscopy. The radii estimates can vary, and we find that the two SDSS-based radii (Gentile Fusillo et al. 2019) tend to give smaller radii than the others. The agreement between the different estimates varies between 1% for the best cases and 3% (rms) for the worst.
The masses based on gravitational redshifts are systematically smaller than those found in recent literature. A small systematic difference exists also with the values estimated by Salaris & Bedin (2018) based on stellar evolution models.
The GR measurement can be improved by using dedicated instruments and observations, such as the recently commissioned ESPRESSO at the VLT (Pepe et al. 2010), which provides enormous advantages thanks to several technical solutions (stability of input, the atmospheric dispersion corrector, and the vacuum instrument). Nevertheless, our results show how powerful the method can be when applied to suitable open clusters. While for other open clusters the situation will be less favourable than for the Hyades, still the uncertainty in their systemic spectroscopic velocities can be of less than 1 km s−1, which induces a typical uncertainty of less than 2% on mass estimates for WDs. This compares very well with alternative methods and it has the potential to approach the accuracy obtained with eclipsing binaries (Parsons et al. 2017).
We finally note that, assuming we know the mass of the WDs from evolutionary and spectroscopic studies, as published in literature, our GR measurements lead to mass values that show agreement to within a few percent with evolutionary and gravitational masses, certainly within the measurement errors. We have therefore tested GR in the gravity regime of WDs to an accuracy of a few percent. There are not many stellar GR measurements present in the literature for WDs, and usually the precision of the measured Doppler shifts is limited. Thus we have brought the consistency between GR and stellar evolution into a novel domain (Parsons et al. 2017), that has thus far only been explored for Sirius B (Joyce et al. 2018).
Acknowledgments
HGL acknowledges financial support by the Sonderforschungsbereich SFB 881 “The Milky Way System” (subprojects A4) of the German Research Foundation (DFG). Research activities of the Observational Astronomy Board of the Federal University of Rio Grande do Norte (UFRN) are supported by continuing grants from the Brazilian agencies CNPq, CAPES and FAPERN. We acknowledge the anonymous referee for several suggestions, especially for pointing out the influence of the mass of the H envelope.
References
- Allende Prieto, C., Lambert, D. L., Tull, R. G., & MacQueen, P. J. 2002, ApJ, 566, L93 [NASA ADS] [CrossRef] [Google Scholar]
- Bergeron, P., Dufour, P., Fontaine, G., et al. 2019, ApJ, 876, 67 [NASA ADS] [CrossRef] [Google Scholar]
- Cummings, J. D., Kalirai, J. S., Tremblay, P.-E., Ramirez-Ruiz, E., & Choi, J. 2018, ApJ, 866, 21 [NASA ADS] [CrossRef] [Google Scholar]
- Davis, D. S., Richer, H. B., King, I. R., et al. 2008, MNRAS, 383, L20 [NASA ADS] [Google Scholar]
- Falcon, R. E., Winget, D. E., Montgomery, M. H., & Williams, K. A. 2010, ApJ, 712, 585 [NASA ADS] [CrossRef] [Google Scholar]
- Fontaine, G., Brassard, P., & Bergeron, P. 2001, PASP, 113, 409 [NASA ADS] [CrossRef] [Google Scholar]
- Gentile Fusillo, N. P., Tremblay, P.-E., Gänsicke, B. T., et al. 2019, MNRAS, 482, 4570 [NASA ADS] [CrossRef] [Google Scholar]
- Gianninas, A., Bergeron, P., & Ruiz, M. T. 2011, ApJ, 743, 138 [NASA ADS] [CrossRef] [Google Scholar]
- Holberg, J. B., & Bergeron, P. 2006, AJ, 132, 1221 [NASA ADS] [CrossRef] [EDP Sciences] [Google Scholar]
- Joyce, S. R. G., Barstow, M. A., Holberg, J. B., et al. 2018, MNRAS, 481, 2361 [NASA ADS] [CrossRef] [Google Scholar]
- Kowalski, P. M., & Saumon, D. 2006, ApJ, 651, L137 [Google Scholar]
- Landolt, A. U., & Uomoto, A. K. 2007, AJ, 133, 768 [NASA ADS] [CrossRef] [Google Scholar]
- Leão, I. C., Pasquini, L., Ludwig, H.-G., & de Medeiros, J. R. 2019, MNRAS, 483, 5026 [NASA ADS] [CrossRef] [Google Scholar]
- Napiwotzki, R., Christlieb, N., Drechsel, H., et al. 2001, Astron. Nachr., 322, 411 [NASA ADS] [CrossRef] [Google Scholar]
- Parsons, S. G., Gänsicke, B. T., Marsh, T. R., et al. 2017, MNRAS, 470, 4473 [NASA ADS] [CrossRef] [Google Scholar]
- Pasquini, L., Cortés, C., Lombardi, M., et al. 2015, A&A, 574, A76 [NASA ADS] [CrossRef] [EDP Sciences] [Google Scholar]
- Pepe, F. A., Cristiani, S., Rebolo Lopez, R., et al. 2010, in Ground-based and Airborne Instrumentation for Astronomy III, Proc. SPIE, 7735, 77350F [CrossRef] [Google Scholar]
- Reid, I. N. 1996, AJ, 111, 2000 [NASA ADS] [CrossRef] [Google Scholar]
- Romero, A. D., Kepler, S. O., Joyce, S. R. G., Lauffer, G. R., & Córsico, A. H. 2019, MNRAS, 484, 2711 [NASA ADS] [Google Scholar]
- Salaris, M., & Bedin, L. R. 2018, MNRAS, 480, 3170 [NASA ADS] [CrossRef] [Google Scholar]
- Tremblay, P.-E., Bergeron, P., & Gianninas, A. 2011, ApJ, 730, 128 [NASA ADS] [CrossRef] [Google Scholar]
- Tremblay, P.-E., Schilbach, E., Röser, S., et al. 2012, A&A, 547, A99 [NASA ADS] [CrossRef] [EDP Sciences] [Google Scholar]
- Tremblay, P.-E., Ludwig, H.-G., Steffen, M., & Freytag, B. 2013, A&A, 559, A104 [NASA ADS] [CrossRef] [EDP Sciences] [Google Scholar]
- Zacharias, N., Finch, C. T., Girard, T. M., et al. 2012, VizieR Online Data Catalog: I/322 [Google Scholar]
- Zuckerman, B., Xu, S., Klein, B., & Jura, M. 2013, ApJ, 770, 140 [NASA ADS] [CrossRef] [Google Scholar]
All Tables
All Figures
|
Fig. 1. Comparison between observations and models in an observational plane: M/R vs. GaiaG magnitudes. Each star is indicated with a different symbol and colour. For each star, its effective temperature has been computed as the average value between the measurements by Cummings et al. (2018) and Gentile Fusillo et al. (2019) and the corresponding models are over-imposed and colour-coded as the corresponding star. All stars lay below the corresponding curves, indicating a discrepancy between the adopted models and our observations. |
| In the text | |
Current usage metrics show cumulative count of Article Views (full-text article views including HTML views, PDF and ePub downloads, according to the available data) and Abstracts Views on Vision4Press platform.
Data correspond to usage on the plateform after 2015. The current usage metrics is available 48-96 hours after online publication and is updated daily on week days.
Initial download of the metrics may take a while.