Fig. 1.
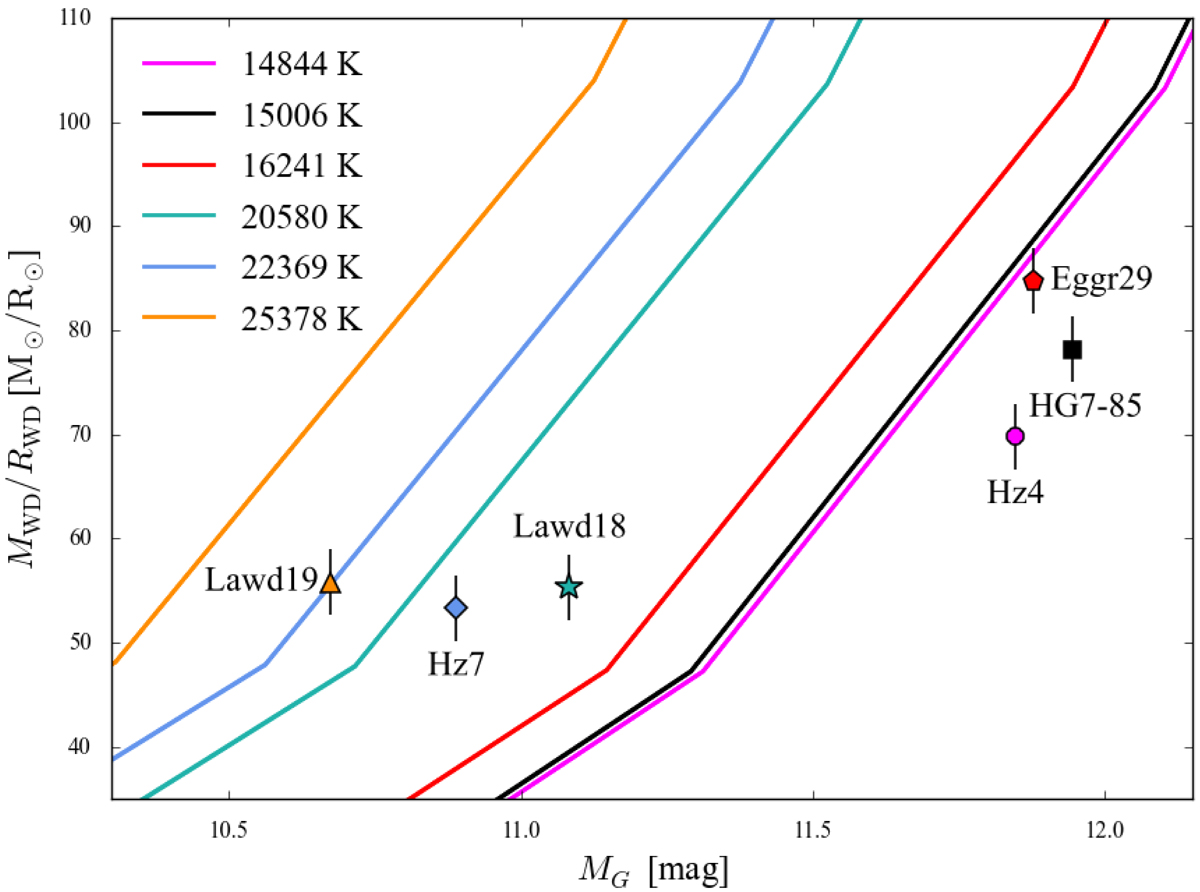
Comparison between observations and models in an observational plane: M/R vs. GaiaG magnitudes. Each star is indicated with a different symbol and colour. For each star, its effective temperature has been computed as the average value between the measurements by Cummings et al. (2018) and Gentile Fusillo et al. (2019) and the corresponding models are over-imposed and colour-coded as the corresponding star. All stars lay below the corresponding curves, indicating a discrepancy between the adopted models and our observations.
Current usage metrics show cumulative count of Article Views (full-text article views including HTML views, PDF and ePub downloads, according to the available data) and Abstracts Views on Vision4Press platform.
Data correspond to usage on the plateform after 2015. The current usage metrics is available 48-96 hours after online publication and is updated daily on week days.
Initial download of the metrics may take a while.