Fig. 7.
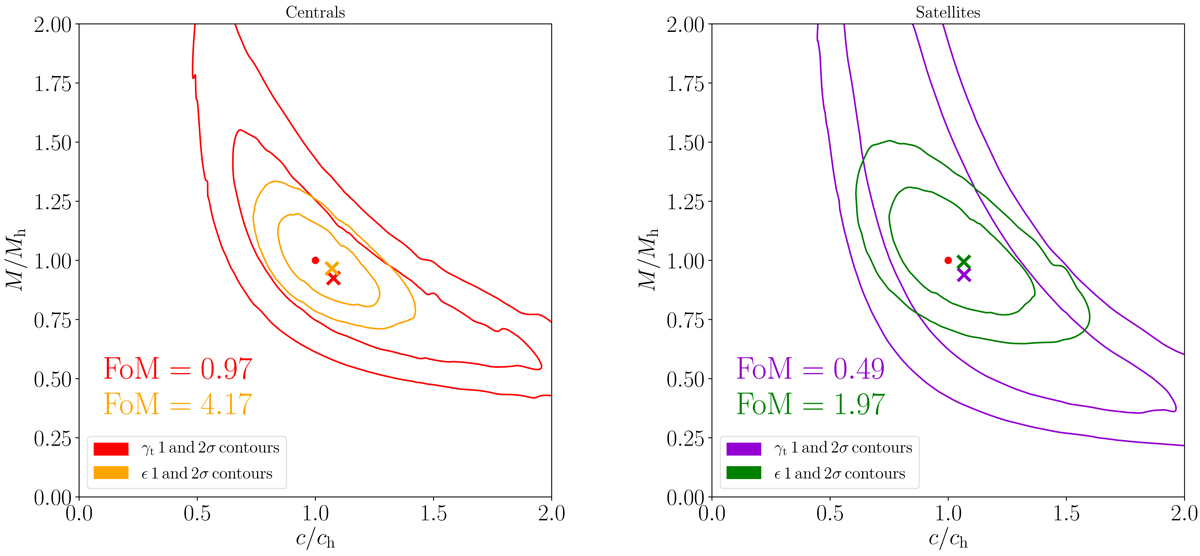
Left panel: confidence areas of the halo mass Mh and concentration c of central galaxies for the analysis of the EAGLE simulation using the one-dimensional method and the two-dimensional method, scaled with the input stellar-to-halo mass relation and the concentration–mass relation. Right panel: confidence areas of the halo mass Mh and concentration c of satellite galaxies for the analysis of the EAGLE simulation using the one-dimensional method and the two-dimensional method, scaled with the input stellar-to-halo mass relation and the concentration–mass relation. The contours show the results of the maximum likelihood fit on the central galaxies (red and purple) and satellite galaxies (orange and green). Crosses (in corresponding colours) show the best-fitting values for each method and galaxy sample, and the red circles show the fiducial models. The contours are calculated from the contours obtained as a fit of the f and g parameters.
Current usage metrics show cumulative count of Article Views (full-text article views including HTML views, PDF and ePub downloads, according to the available data) and Abstracts Views on Vision4Press platform.
Data correspond to usage on the plateform after 2015. The current usage metrics is available 48-96 hours after online publication and is updated daily on week days.
Initial download of the metrics may take a while.