Fig. 5.
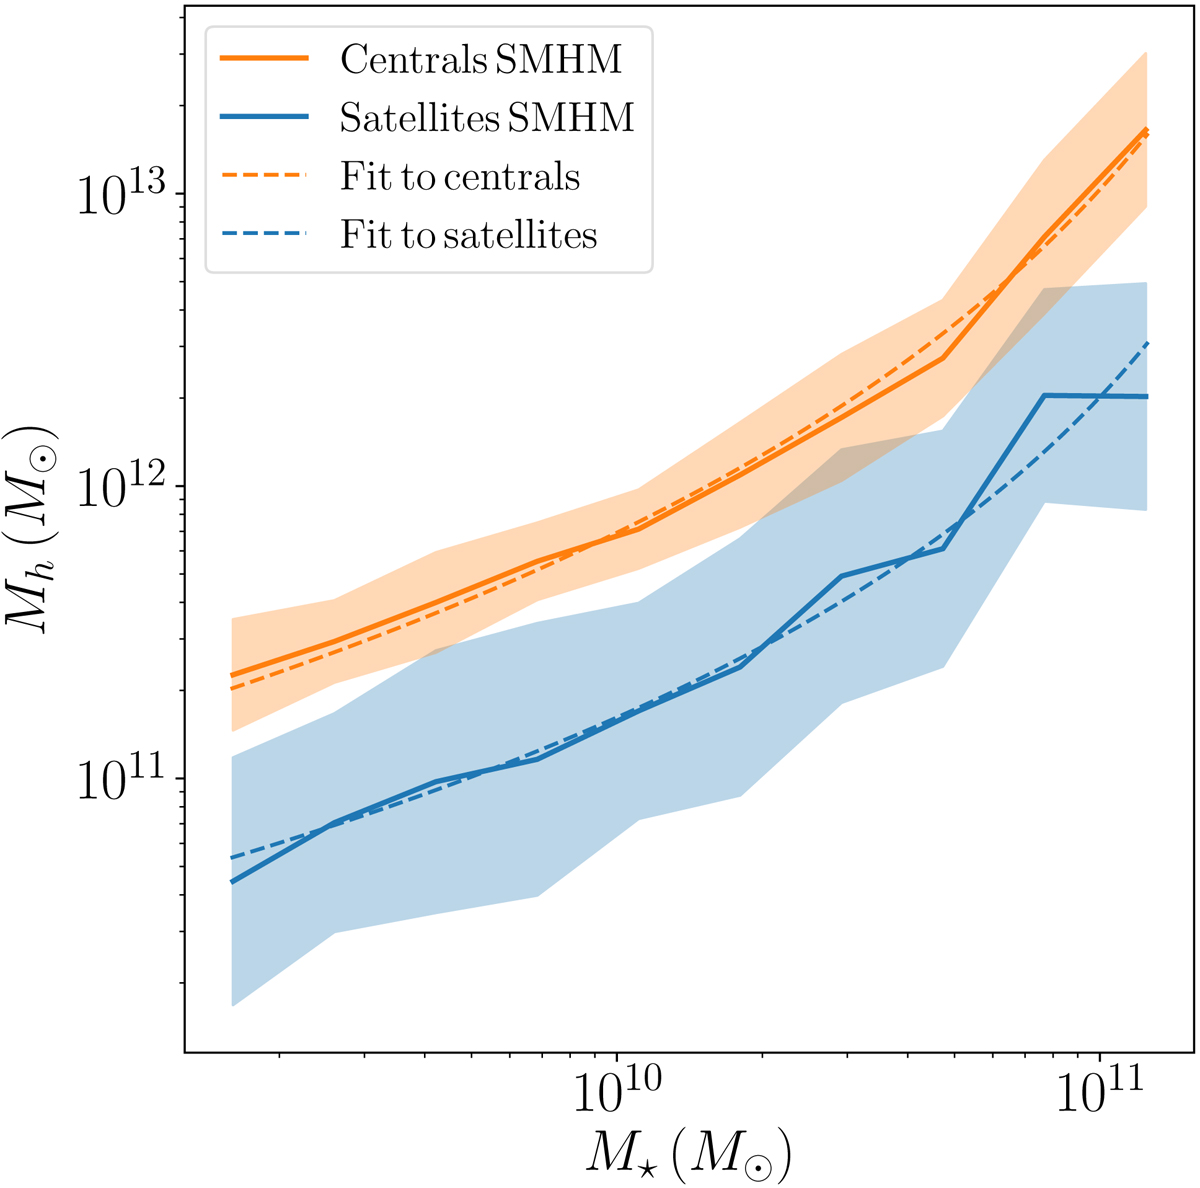
Stellar-to-halo mass relation for the central galaxies in the EAGLE simulation (in orange) and for the satellites (in blue). Shown are the median stellar-to-halo mass relation (solid lines) with the corresponding scatter (filled areas). The dashed lines are the models for the stellar-to-halo mass relation used in the analysis.
Current usage metrics show cumulative count of Article Views (full-text article views including HTML views, PDF and ePub downloads, according to the available data) and Abstracts Views on Vision4Press platform.
Data correspond to usage on the plateform after 2015. The current usage metrics is available 48-96 hours after online publication and is updated daily on week days.
Initial download of the metrics may take a while.