Fig. 2.
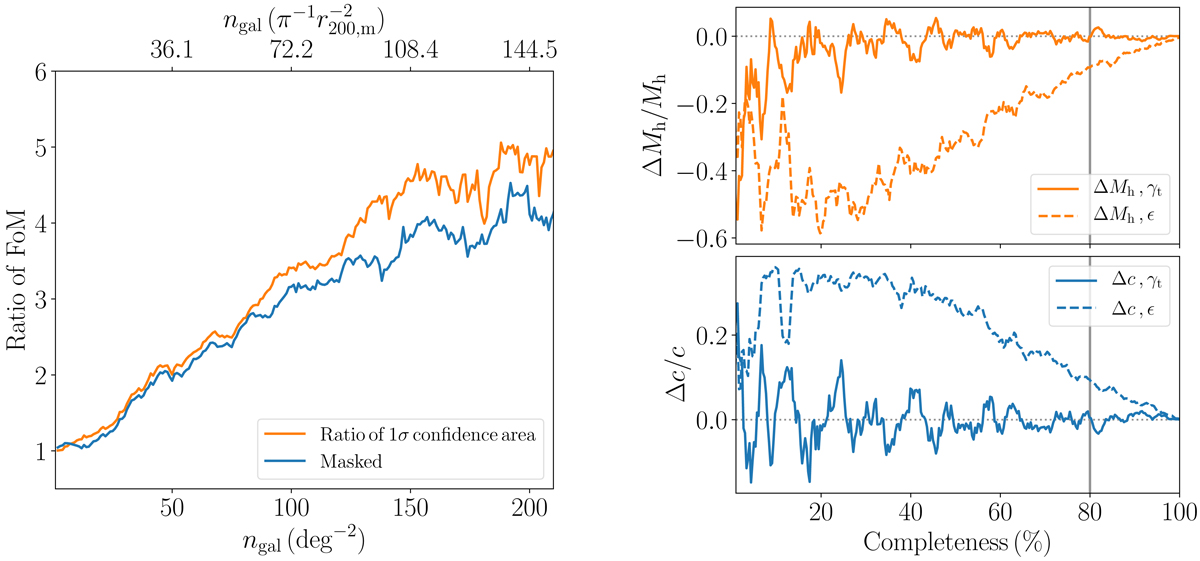
Left panel: figure of merit as a function of lens number density in a simulated 1 deg2 field. The orange line shows the case where we consider all the galaxies in the field, and thus gives us an estimate of improvement in precision when using a two-dimensional method. The improvement levels off at a value of around 5, which indicates that in dense galaxy fields, the loss of signal-to-noise ratio due to the limited number of sources cannot be overcome. The blue line shows the case where we apply a typical KiDS survey mask to our mock catalogues. Right panel: relative shift of the halo mass Mh (top) and halo concentration c (bottom) derived from the constraints on the f and g parameters from the fiducial model as a function of completeness. Shown are the shift of the recovered parameters for the one-dimensional method (solid lines) and the shift of the recovered parameters for the two-dimensional method (dashed lines). Also shown is a typical completeness due to a mask in a KiDS like survey (vertical grey line).
Current usage metrics show cumulative count of Article Views (full-text article views including HTML views, PDF and ePub downloads, according to the available data) and Abstracts Views on Vision4Press platform.
Data correspond to usage on the plateform after 2015. The current usage metrics is available 48-96 hours after online publication and is updated daily on week days.
Initial download of the metrics may take a while.