Fig. 1.
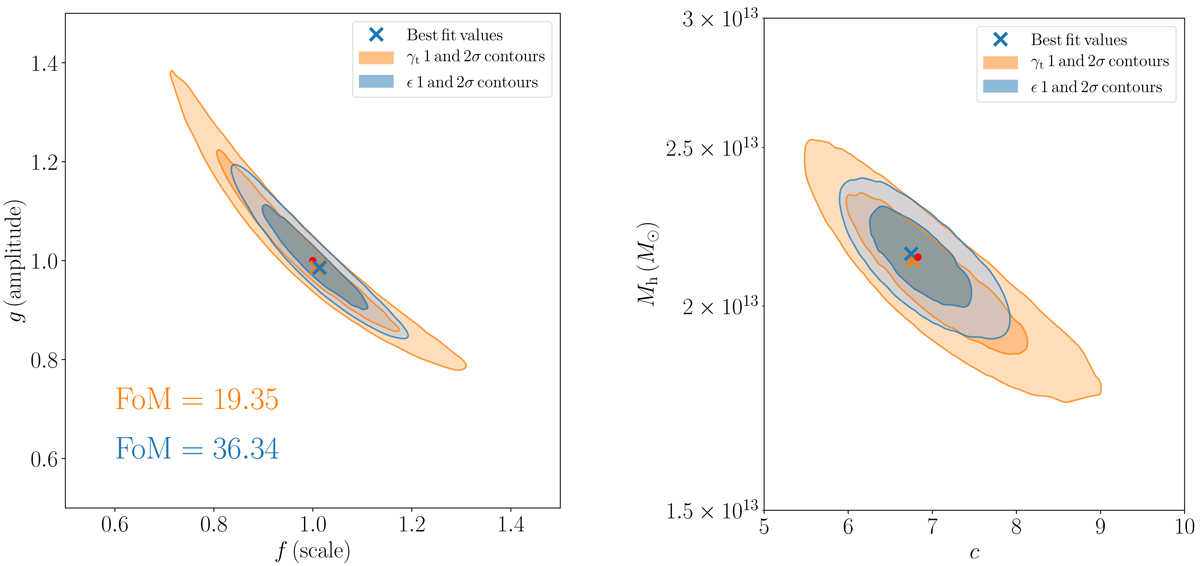
Confidence areas of the scale parameter f and amplitude parameter g (left panel) and the confidence areas of the halo mass Mh and halo concentration c jointly derived from the constraints on the f and g parameters (right panel) for an analysis of the mock KiDS+GAMA area. Orange contours show the maximum likelihood fit on the stacked tangential shear profiles, and the blue contours the maximum likelihood fit as it was performed on the ellipticities of sources used directly, using all the galaxies in the mock field simultaneously. Shown are the best-fitting values for each method (orange and blue crosses) and the fiducial lens model (red circle). The contours correspond to the case with 50 lenses per deg2 in the simulated field.
Current usage metrics show cumulative count of Article Views (full-text article views including HTML views, PDF and ePub downloads, according to the available data) and Abstracts Views on Vision4Press platform.
Data correspond to usage on the plateform after 2015. The current usage metrics is available 48-96 hours after online publication and is updated daily on week days.
Initial download of the metrics may take a while.