Fig. 5.
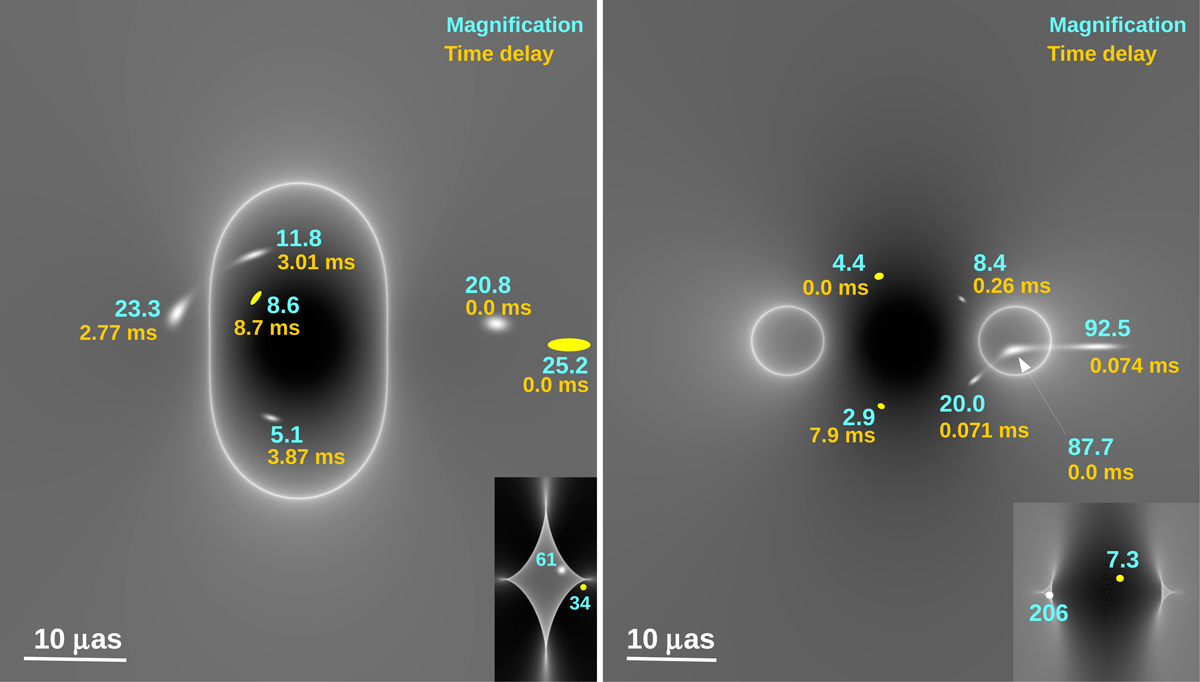
Example of a source at z = 2 lensed by a microlens with 100 M⊙ embedded in a macromodel at z = 0.5 with magnifications μt = 10 and μr = 3. Left panel: the large image shows the magnification around the microlens in the image plane (with the critical curve) and the microimages. The small image on the bottom-right shows the magnification in the source plane with two sources in white and yellow. The surface brightness of the source is assumed to follow a Gaussian distribution (in white). Without the microlens, there would be a single lensed microimage with magnification 30. The microlens boosts the magnification by a factor ≈2 and breaks the macroimage into four microimages introducing time delays between them of up to 3.87 ms, i.e., in LIGO’s range. Right panel: similar to the left panel but for a microlens in the side with macromodel negative parity. We note how the high magnification region is now smaller but the maximum magnification can be higher. In contrast, areas of small relative magnification (and larger time delays) are more common.
Current usage metrics show cumulative count of Article Views (full-text article views including HTML views, PDF and ePub downloads, according to the available data) and Abstracts Views on Vision4Press platform.
Data correspond to usage on the plateform after 2015. The current usage metrics is available 48-96 hours after online publication and is updated daily on week days.
Initial download of the metrics may take a while.