Fig. 21.
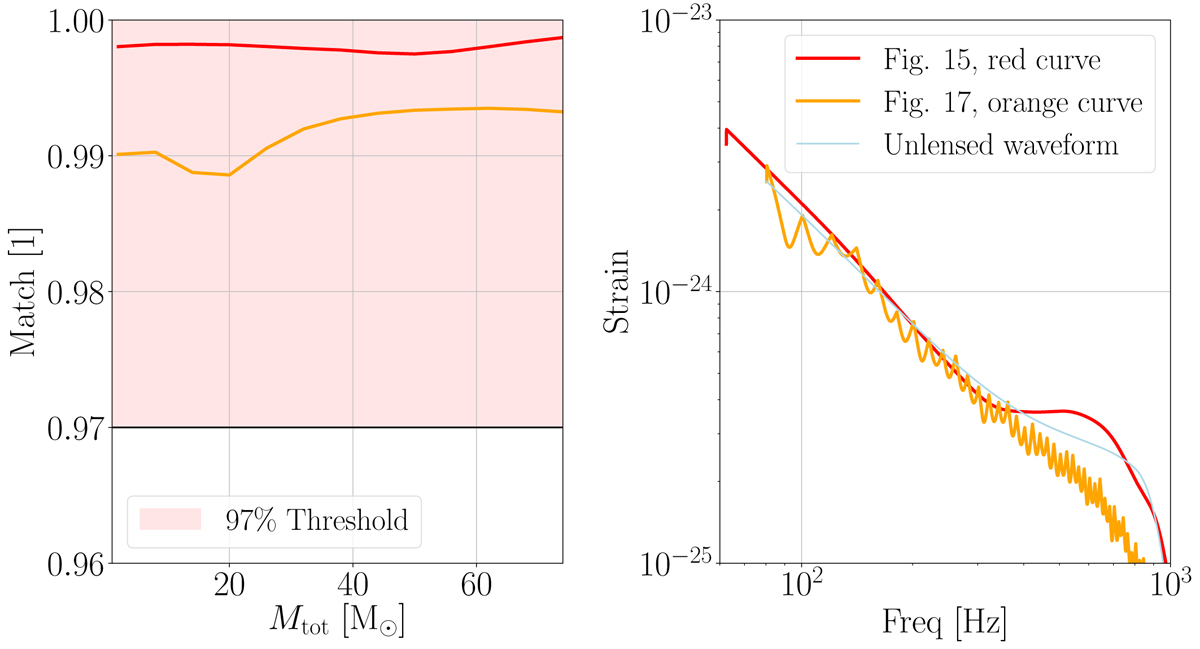
Left panel: waveform match between the microlensed and lensed waveform as a function of the total mass of the binary Mtot. Right panel: strain amplitude as a function of frequency for the lensed and unlensed waveform with Mtot = 20 M⊙. The red and orange curves utilize the lens configurations and magnification factors shown in Figs. 17 and 19, respectively, while the black line (right panel) shows the unlensed waveform. The waveform corrections are at percent level.
Current usage metrics show cumulative count of Article Views (full-text article views including HTML views, PDF and ePub downloads, according to the available data) and Abstracts Views on Vision4Press platform.
Data correspond to usage on the plateform after 2015. The current usage metrics is available 48-96 hours after online publication and is updated daily on week days.
Initial download of the metrics may take a while.