Fig. 20.
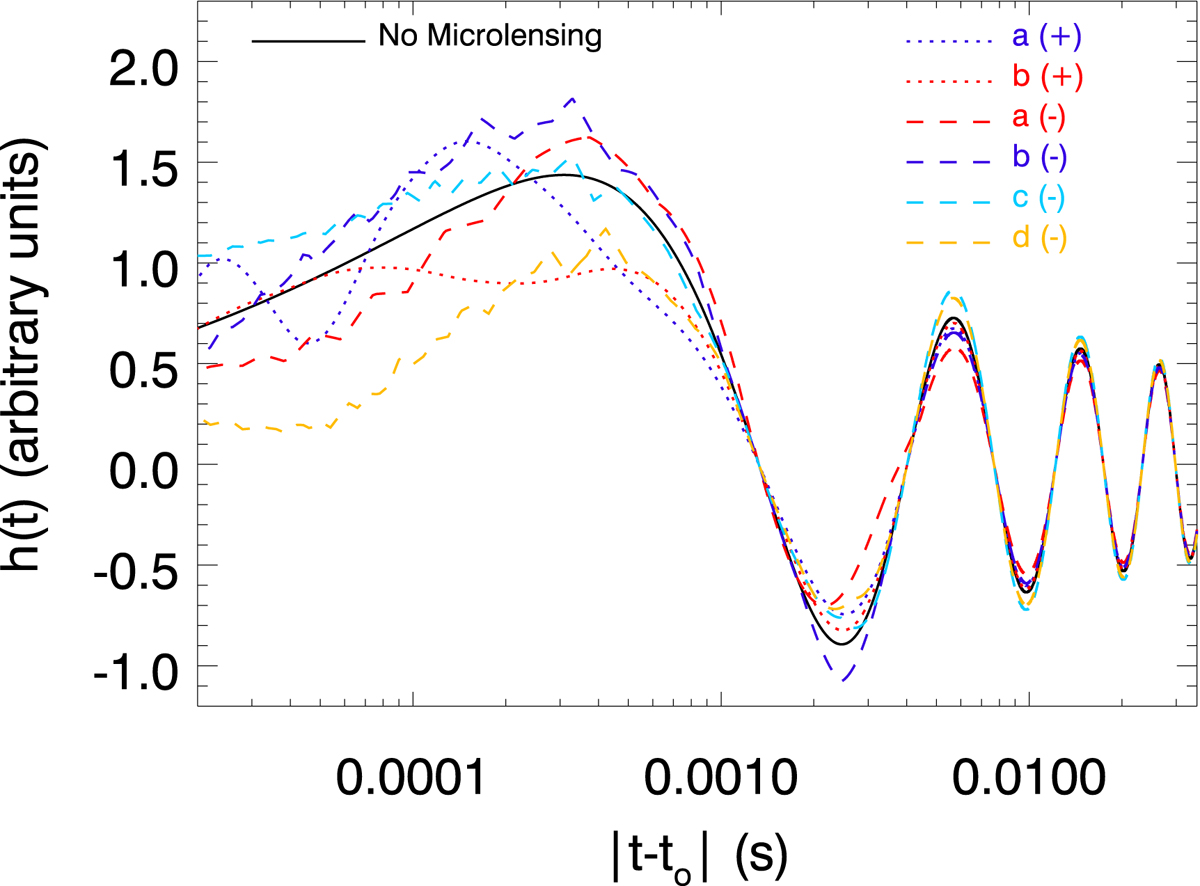
Simulated strain with no-lensing of the coalescence of a BBH with 10 and 12 M⊙ at z = 2 (solid black line). We note that in order to zoom in the highest frequencies, we plot the strain as a function of |t − t0| where the time, t0, corresponds to zero in the x-axis. The dashed lines show the distortion of the strain for the different microlensing scenarios (by stellar bodies) discussed in Figs. 15 and 17.
Current usage metrics show cumulative count of Article Views (full-text article views including HTML views, PDF and ePub downloads, according to the available data) and Abstracts Views on Vision4Press platform.
Data correspond to usage on the plateform after 2015. The current usage metrics is available 48-96 hours after online publication and is updated daily on week days.
Initial download of the metrics may take a while.