Fig. 2.
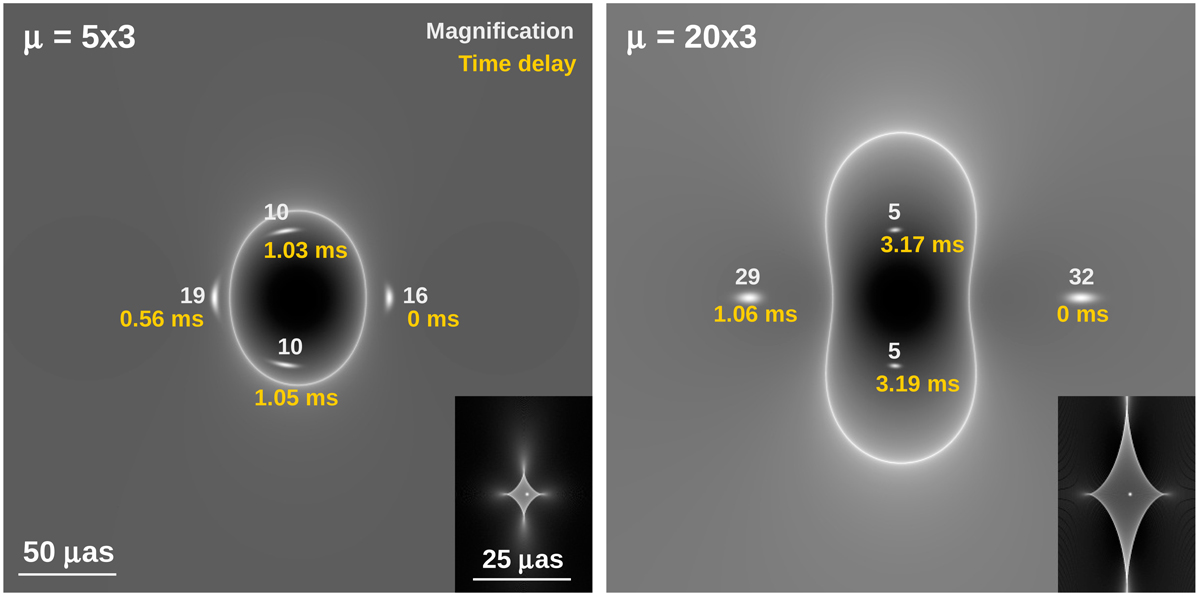
Microlensing by a 100 M⊙ star at two different macromodel magnifications of 15 (μt = 5 and μr = 3, left) and 60 (μt = 20 and μr = 3, right). The field of view is the same in both cases. In each case, the larger panel shows the magnification in the lens plane (critical curve) while the small panel in the bottom-right corner shows the corresponding magnification in the source plane (caustic). The small white dot inside the caustic marks the position of the source. The numbers in the larger panels indicate the magnification of each microimage and the corresponding time delays (in milliseconds) relative to the image that arrives first (marked with 0 ms). The separation between the source and the projected position of the microlens is the same in both cases. We note how at larger macromodel magnifications, both the time delays and the area enclosed by the caustic (i.e., the probability of microlensing) are larger.
Current usage metrics show cumulative count of Article Views (full-text article views including HTML views, PDF and ePub downloads, according to the available data) and Abstracts Views on Vision4Press platform.
Data correspond to usage on the plateform after 2015. The current usage metrics is available 48-96 hours after online publication and is updated daily on week days.
Initial download of the metrics may take a while.