Free Access
Fig. 15.
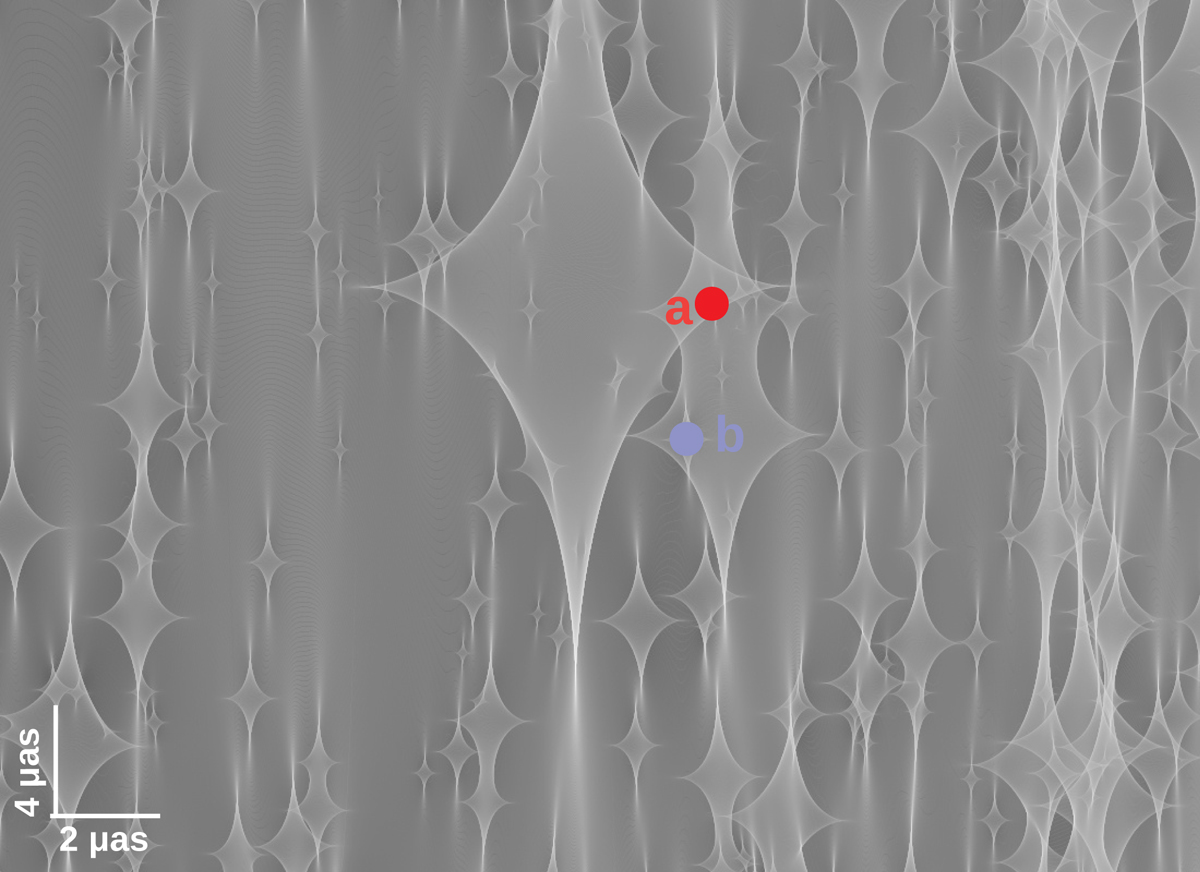
Caustic region on the side with positive parity. This region shows approximately half the simulated region. The largest microcaustic corresponds to the largest microlens of 11.3 M⊙. The red dot marks the position of the background source for which the microimages are shown in Fig. 14.
Current usage metrics show cumulative count of Article Views (full-text article views including HTML views, PDF and ePub downloads, according to the available data) and Abstracts Views on Vision4Press platform.
Data correspond to usage on the plateform after 2015. The current usage metrics is available 48-96 hours after online publication and is updated daily on week days.
Initial download of the metrics may take a while.