Fig. 14.
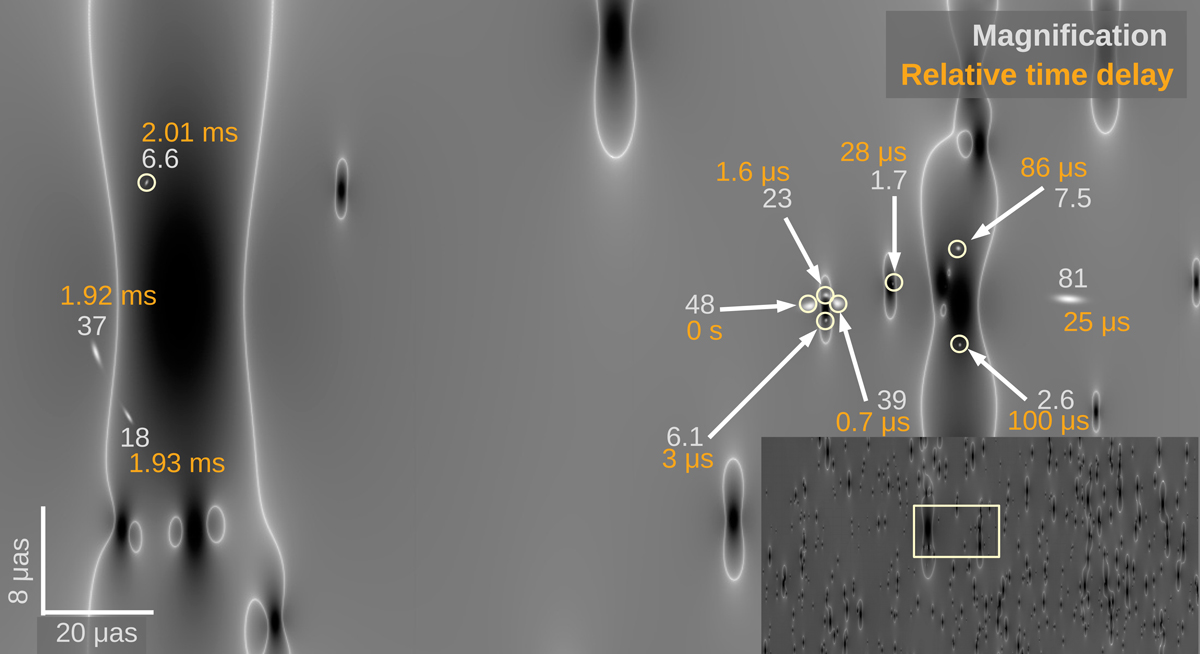
Zoom-in the region around a pair of microlenses with 11.3 M⊙ and 2.2 M⊙ in our simulated map. The entire simulated region is shown in the bottom right corner with the zoomed region marked with a rectangle. The arcs formed by a background source are shown in white. Small microimages are marked with a white circle. The magnifications and relative time delays are shown for each microimage.
Current usage metrics show cumulative count of Article Views (full-text article views including HTML views, PDF and ePub downloads, according to the available data) and Abstracts Views on Vision4Press platform.
Data correspond to usage on the plateform after 2015. The current usage metrics is available 48-96 hours after online publication and is updated daily on week days.
Initial download of the metrics may take a while.