Fig. 1.
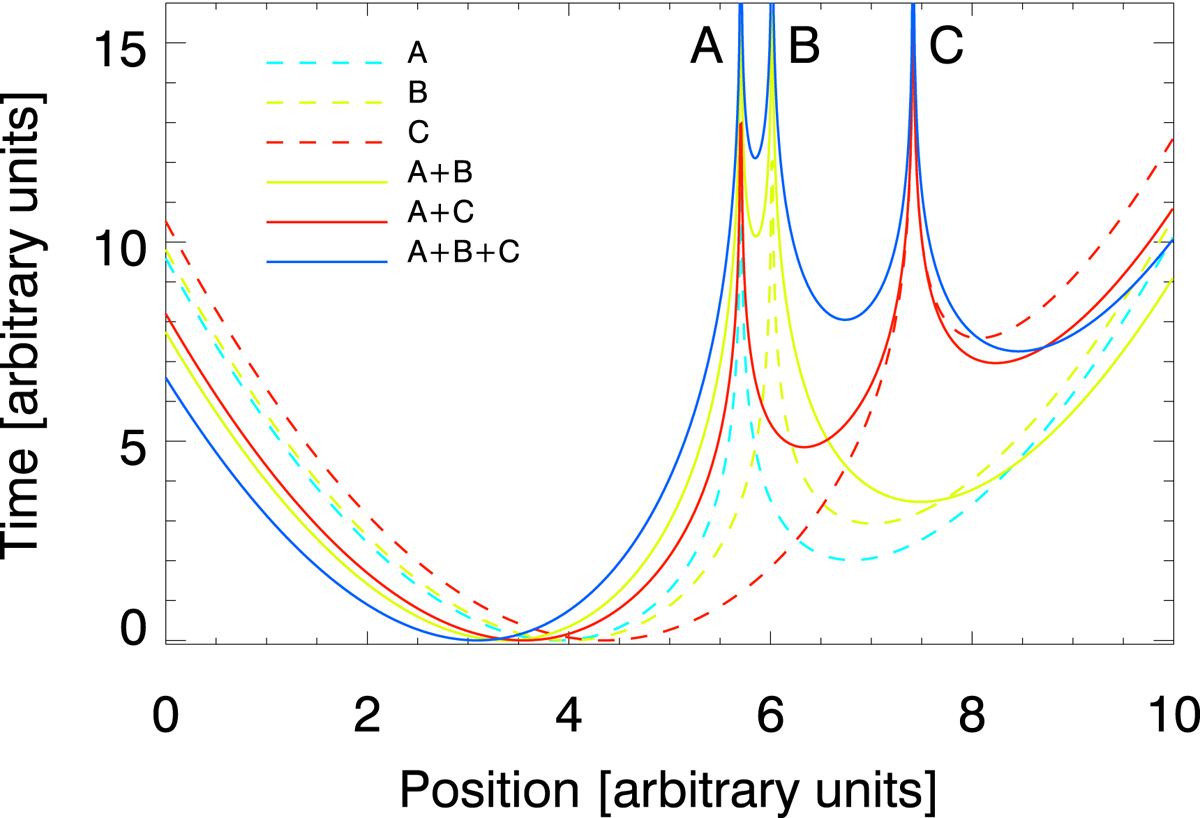
Time delay in one dimension with two and three microlenses. The microlenses are at positions A, B, and C. The dashed lines show the time delay when only one of the three microlenses is considered. The solid lines corresponds to the time delay when two or three microlenses are considered. Microimages form around the positions where the derivative of the time delay equals zero. The magnification of each microimage is inversely proportional to the curvature (i.e., second derivatives) of the time delay around these positions.
Current usage metrics show cumulative count of Article Views (full-text article views including HTML views, PDF and ePub downloads, according to the available data) and Abstracts Views on Vision4Press platform.
Data correspond to usage on the plateform after 2015. The current usage metrics is available 48-96 hours after online publication and is updated daily on week days.
Initial download of the metrics may take a while.