Fig. 7.
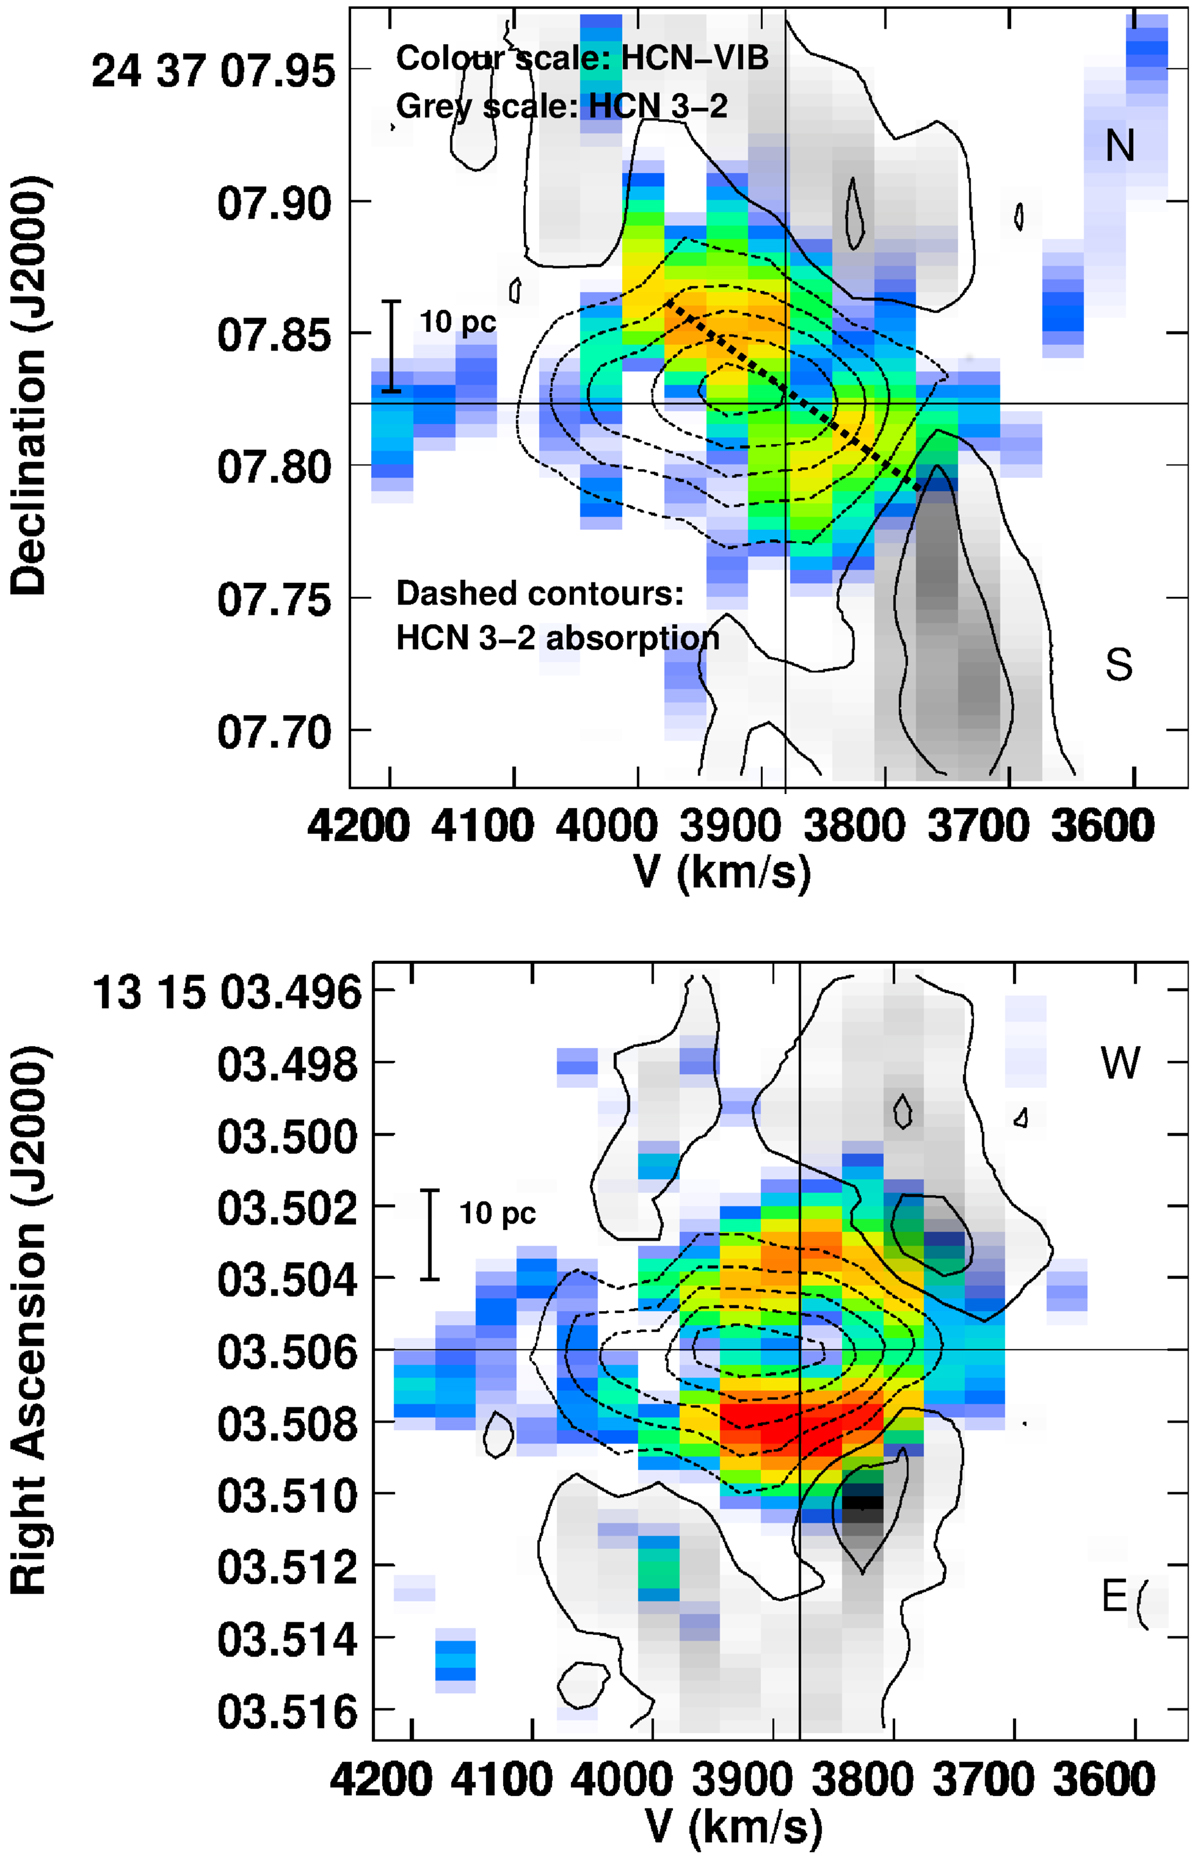
Position velocity (pV) diagrams of HCN-VIB and HCN 3–2. Colours indicate HCN-VIB and greyscale indicates HCN 3–2 emission – both range from 1 to 6.5 mJy beam−1. The contour range is 1.2 × ( − 9, −7, −5, −3, −1, 1, 3). HCN 3–2 absorption is indicated by negative, dashed contour lines. Top panel: cut is along the north–south (PA = 0°) major axis of the nuclear disk. The black dashed line indicates the intensity weighted rotational velocity within r = 10 pc. Lower panel: cut is along the east–west (PA = 90°) minor axis of the nuclear disk. The νsys of 3880 km s−1 is indicated with a vertical black line. The position of the band 6 continuum is indicated by a horizontal black line.
Current usage metrics show cumulative count of Article Views (full-text article views including HTML views, PDF and ePub downloads, according to the available data) and Abstracts Views on Vision4Press platform.
Data correspond to usage on the plateform after 2015. The current usage metrics is available 48-96 hours after online publication and is updated daily on week days.
Initial download of the metrics may take a while.