Fig. 6.
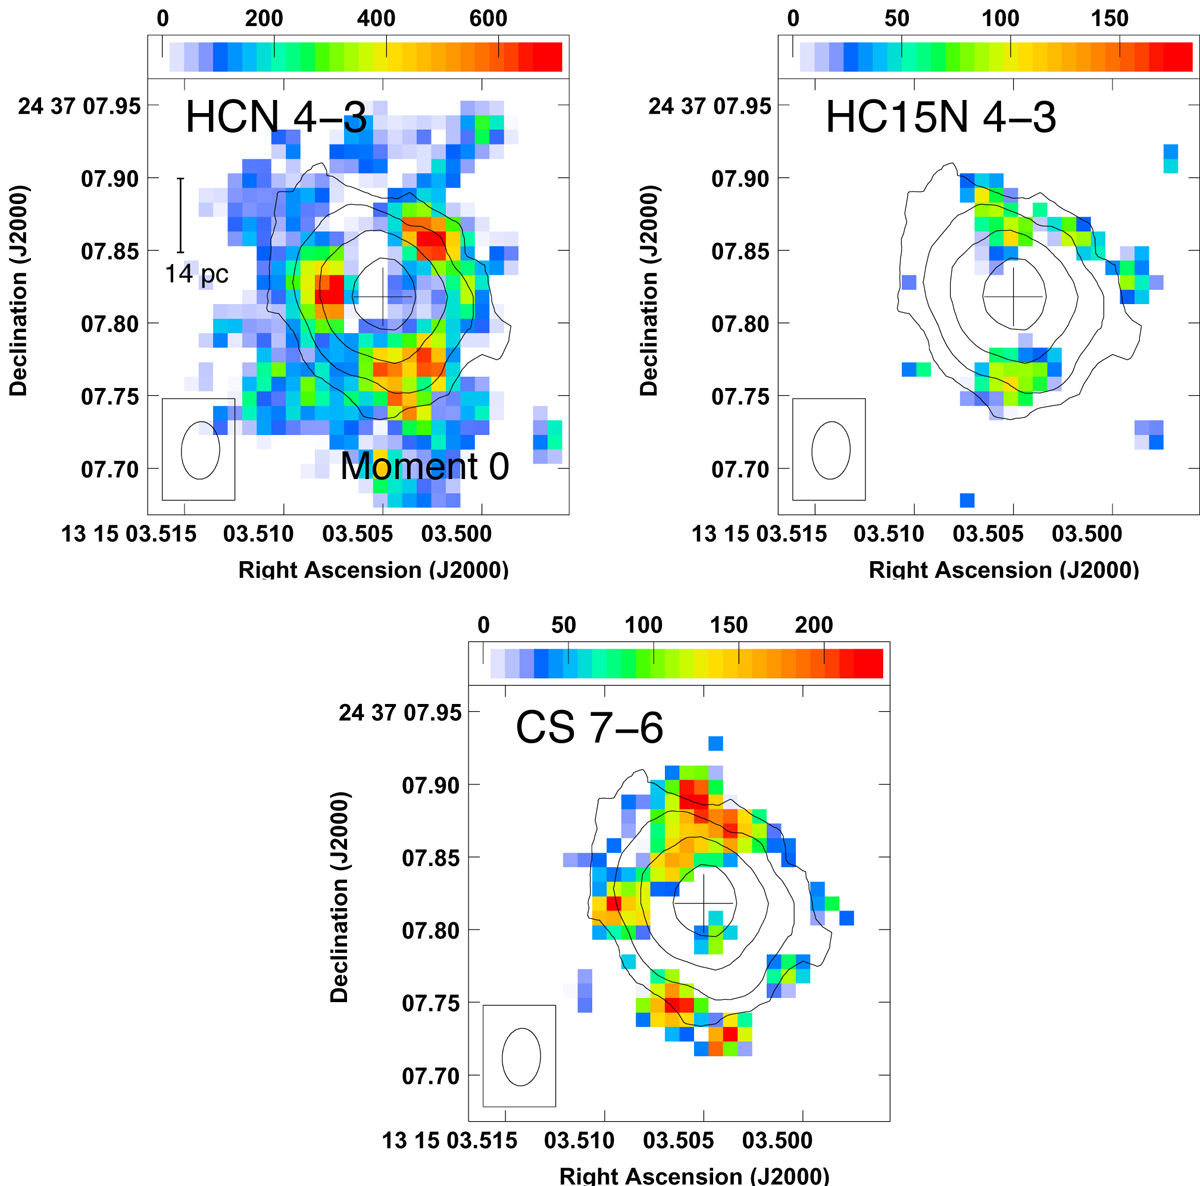
Band 7 moment 0 maps (of emission only) of three ground-state lines overlayed on the 343 GHz continuum contours (0.74 × (1, 2, 4, 8) mJy). We note that the white “hole” in the centre is due to absorption and that absorption affects the line profiles out to at least 50% of the continuum. Some of the “missing” emission in structures is also due to line self-absorption. The cross marks the position of the continuum peak. Left panel: HCN 4–3 where colours range from 0 to 0.7 Jy km s−1 beam−1; Centre panel: HC15N 4–3 with colours ranging from 0 to 0.18 Jy km s−1 beam−1; Right panel: CS 7–6 with colours ranging from 0 to 0.23 Jy km s−1 beam−1.
Current usage metrics show cumulative count of Article Views (full-text article views including HTML views, PDF and ePub downloads, according to the available data) and Abstracts Views on Vision4Press platform.
Data correspond to usage on the plateform after 2015. The current usage metrics is available 48-96 hours after online publication and is updated daily on week days.
Initial download of the metrics may take a while.