Fig. 4.
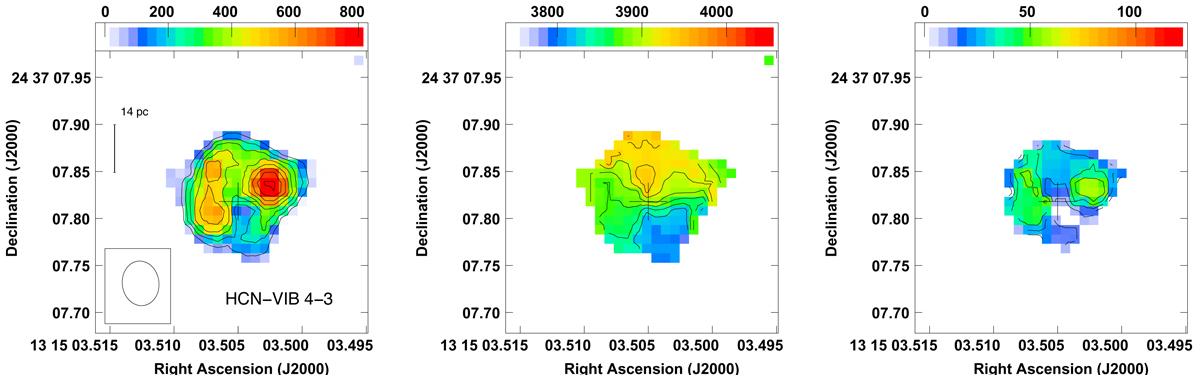
HCN-VIB 4–3 moment maps. Left: integrated intensity (mom0) where contours are 0.1 × (1, 2, 3, 4, 5, 6, 7, 8, 9) Jy km s−1 beam−1. Colours range from 0 to 1.0 Jy km s−1 beam−1. Centre: velocity field (mom1) where contours range from 3830 km s−1 to 3990 km s−1 in steps of 20 km s−1 and colours range from 3750 to 4050 km s−1. Right: dispersion map (mom2) where contours are 6 × (1, 3, 5, 7, 9) km s−1. Colours range from 0 to 60 km s−1. The cross marks the position of the 350 GHz continuum peak. For better S/N, we present the naturally weighted HCN-VIB 4–3 moment maps here.
Current usage metrics show cumulative count of Article Views (full-text article views including HTML views, PDF and ePub downloads, according to the available data) and Abstracts Views on Vision4Press platform.
Data correspond to usage on the plateform after 2015. The current usage metrics is available 48-96 hours after online publication and is updated daily on week days.
Initial download of the metrics may take a while.