Fig. 2.
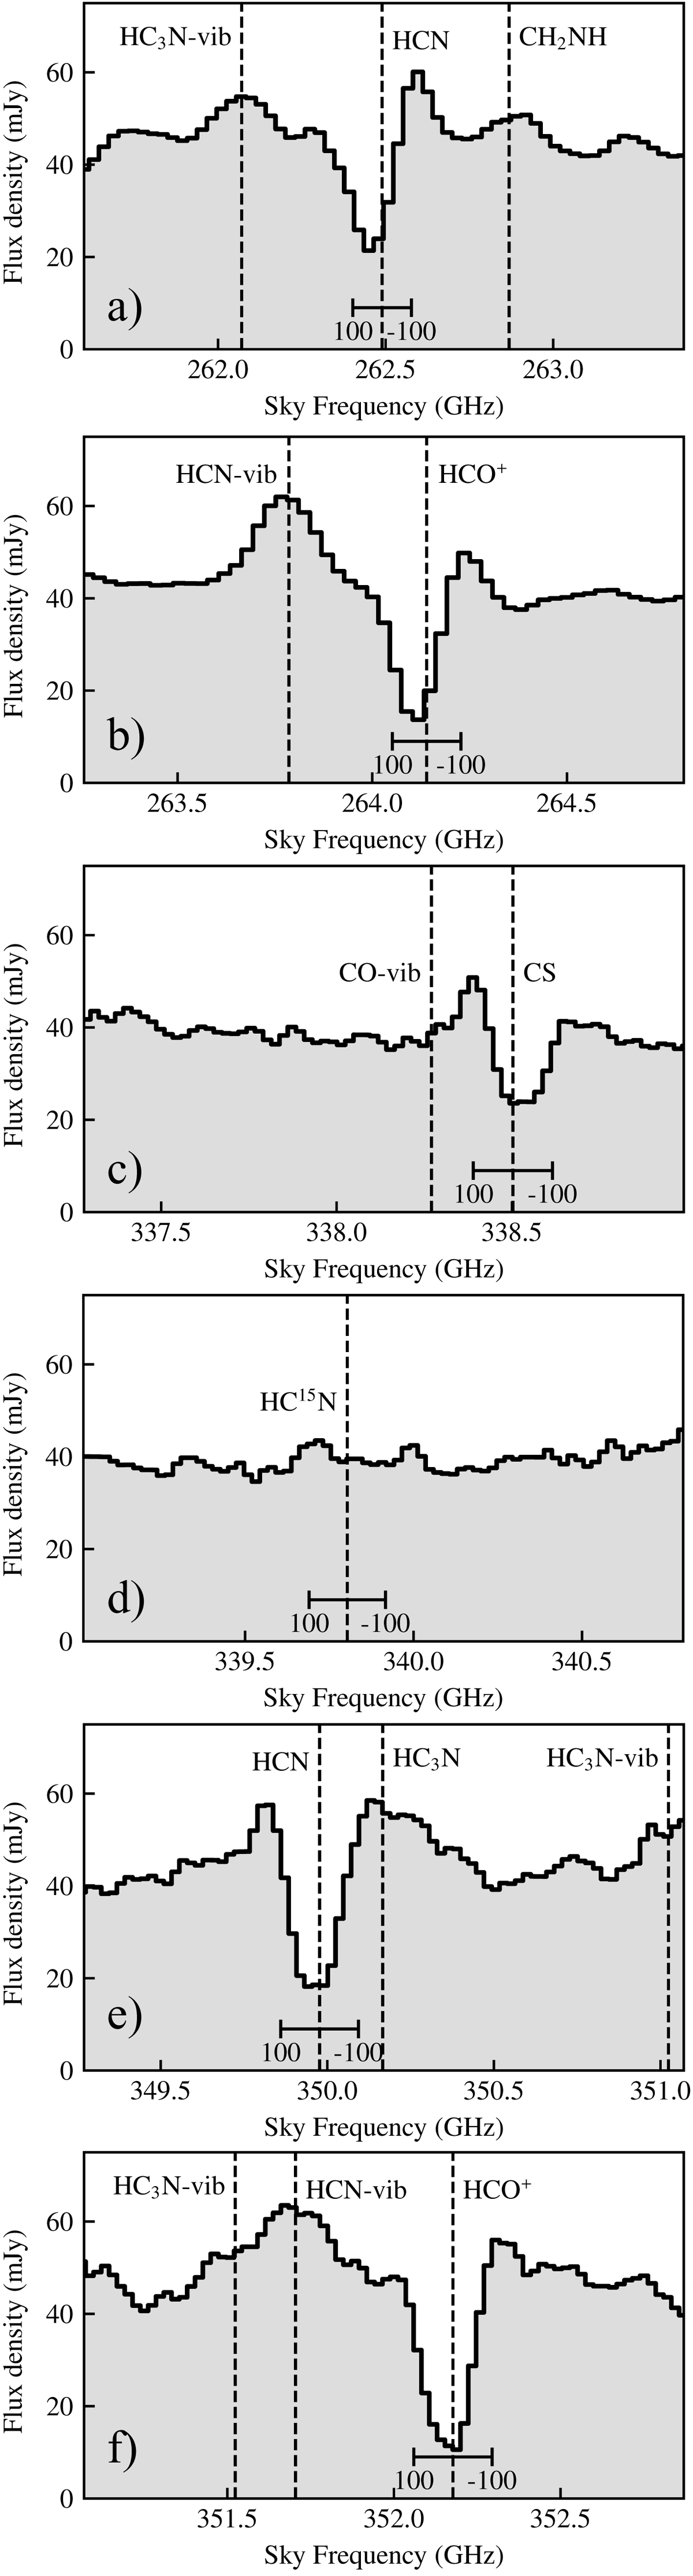
Band 6 and band 7 average spectra of the inner ![]() of the central region. (a) HCN 3–2, HC3N ν7 = 2, CH2NH; (b) HCO+ 3–2, and HCN-VIB 3–2; (c) CS 7–6 with a vibrational line of CO also marked; (d) HC15N 4–3; (e) HCN 4–3, HC3N 39–38, HC3N ν7 = 1; (f) HCO+ 4–3, HCN-VIB 4–3, and HC3N ν7 = 2. The dashed lines mark νsys (cz = 3880 km s−1) of the various species. We also indicate ±100 km s−1 velocities for several of the species.
of the central region. (a) HCN 3–2, HC3N ν7 = 2, CH2NH; (b) HCO+ 3–2, and HCN-VIB 3–2; (c) CS 7–6 with a vibrational line of CO also marked; (d) HC15N 4–3; (e) HCN 4–3, HC3N 39–38, HC3N ν7 = 1; (f) HCO+ 4–3, HCN-VIB 4–3, and HC3N ν7 = 2. The dashed lines mark νsys (cz = 3880 km s−1) of the various species. We also indicate ±100 km s−1 velocities for several of the species.
Current usage metrics show cumulative count of Article Views (full-text article views including HTML views, PDF and ePub downloads, according to the available data) and Abstracts Views on Vision4Press platform.
Data correspond to usage on the plateform after 2015. The current usage metrics is available 48-96 hours after online publication and is updated daily on week days.
Initial download of the metrics may take a while.