Fig. 9.
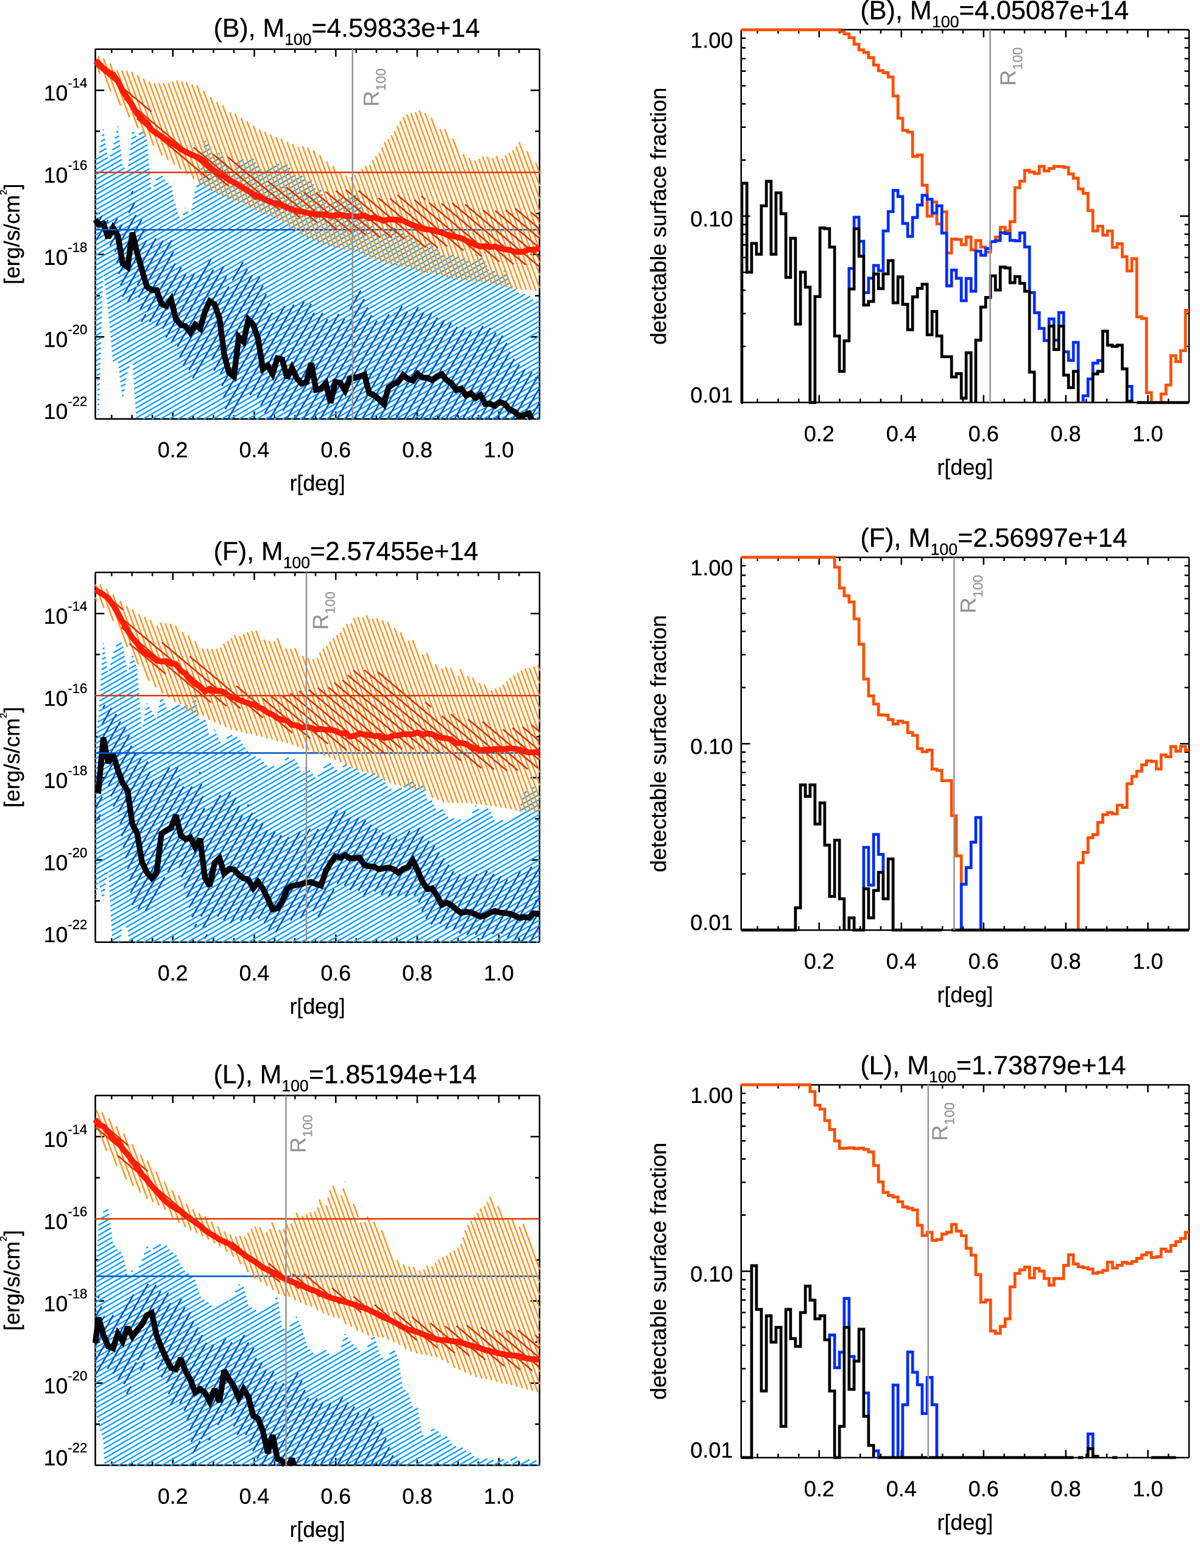
Left panels: 2D X-ray (in the [0.8–1.2] keV range, in red, and radio emission (at 260 MHz, blue curves) profiles for the three halos in our volume at z = 0.05, showing the median (thick lines) and the 33 − 66% and 5 − 95% percentile ranges (shaded areas). The horizontal axis gives the angular distance from the centre of each cluster. The horizontal lines give the reference X-ray (red) and the radio (blue) detection threshold considered in the paper, while the vertical grey lines give the location of R100 for each cluster. Right panels: radial profiles of the surface fraction that can be detected in X-ray (red), in radio (blue), or by both (black) for the same objects.
Current usage metrics show cumulative count of Article Views (full-text article views including HTML views, PDF and ePub downloads, according to the available data) and Abstracts Views on Vision4Press platform.
Data correspond to usage on the plateform after 2015. The current usage metrics is available 48-96 hours after online publication and is updated daily on week days.
Initial download of the metrics may take a while.