Free Access
Fig. 7.
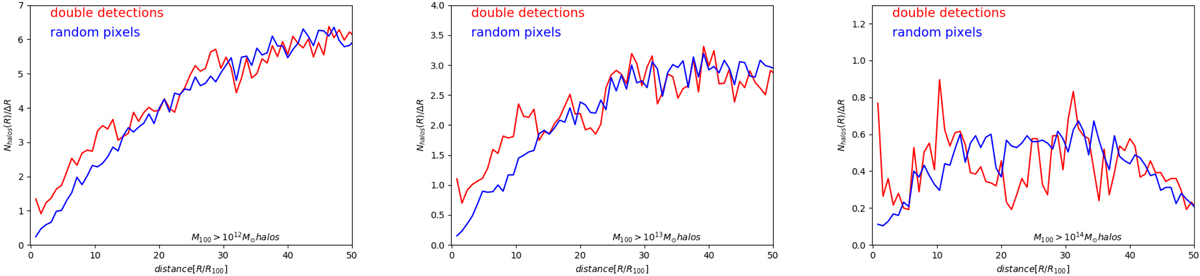
Average number of clusters (considering a different lower threshold in mass) at a given distance from the location of joint detections in our simulations. The blue data are for the distances computed from a randomly drawn set of positions, for a number of points equal to our jointly detectable pixels.
Current usage metrics show cumulative count of Article Views (full-text article views including HTML views, PDF and ePub downloads, according to the available data) and Abstracts Views on Vision4Press platform.
Data correspond to usage on the plateform after 2015. The current usage metrics is available 48-96 hours after online publication and is updated daily on week days.
Initial download of the metrics may take a while.