Fig. 5.
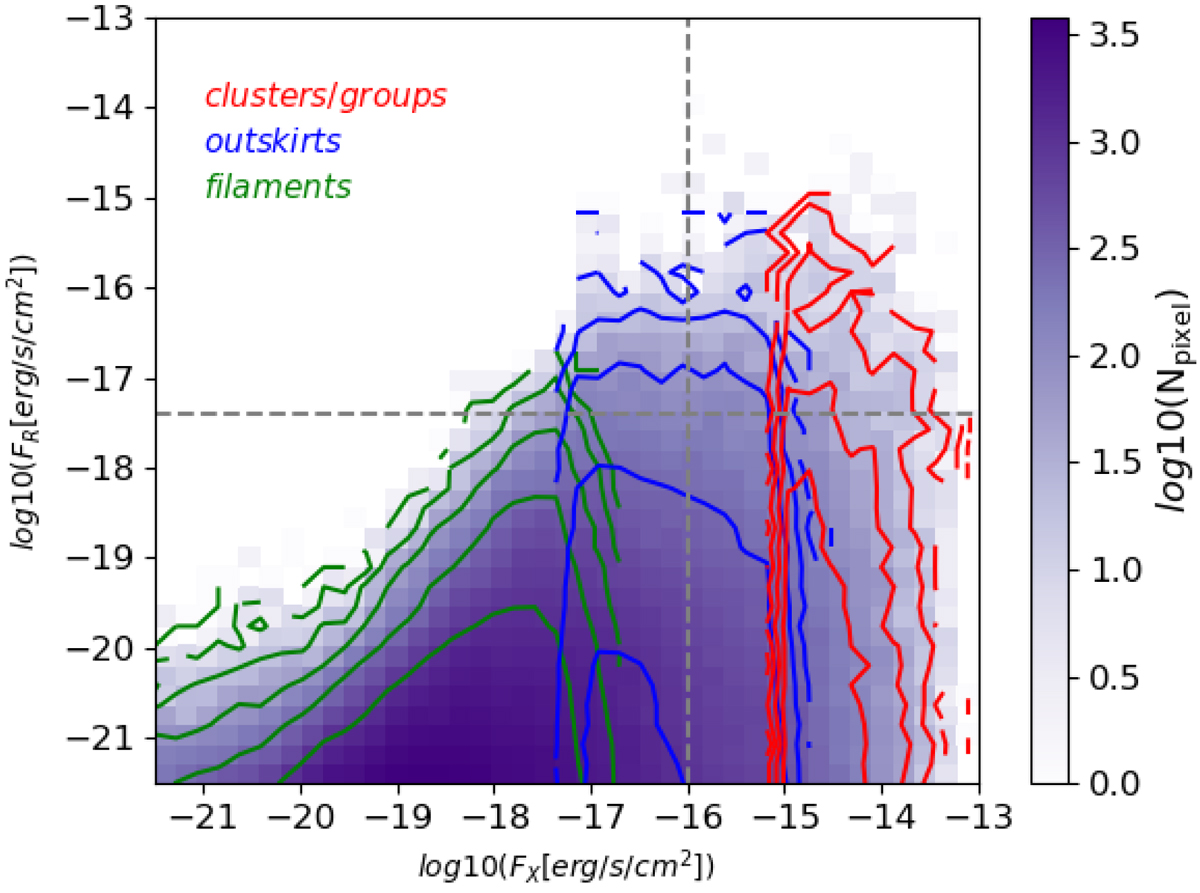
Distribution of X-ray and radio flux for all simulated pixels in our sky model (Fig. 2). The contours are equally spaced in logarithmic space (Δlog10 = 0.5) and show the distributions of pixels associated with filaments (green), cluster outskirts (blue), or the virial region of galaxy clusters and groups (red). The additional grey lines delimit the regions that will become observable with future X-ray and radio telescopes.
Current usage metrics show cumulative count of Article Views (full-text article views including HTML views, PDF and ePub downloads, according to the available data) and Abstracts Views on Vision4Press platform.
Data correspond to usage on the plateform after 2015. The current usage metrics is available 48-96 hours after online publication and is updated daily on week days.
Initial download of the metrics may take a while.