Fig. 3.
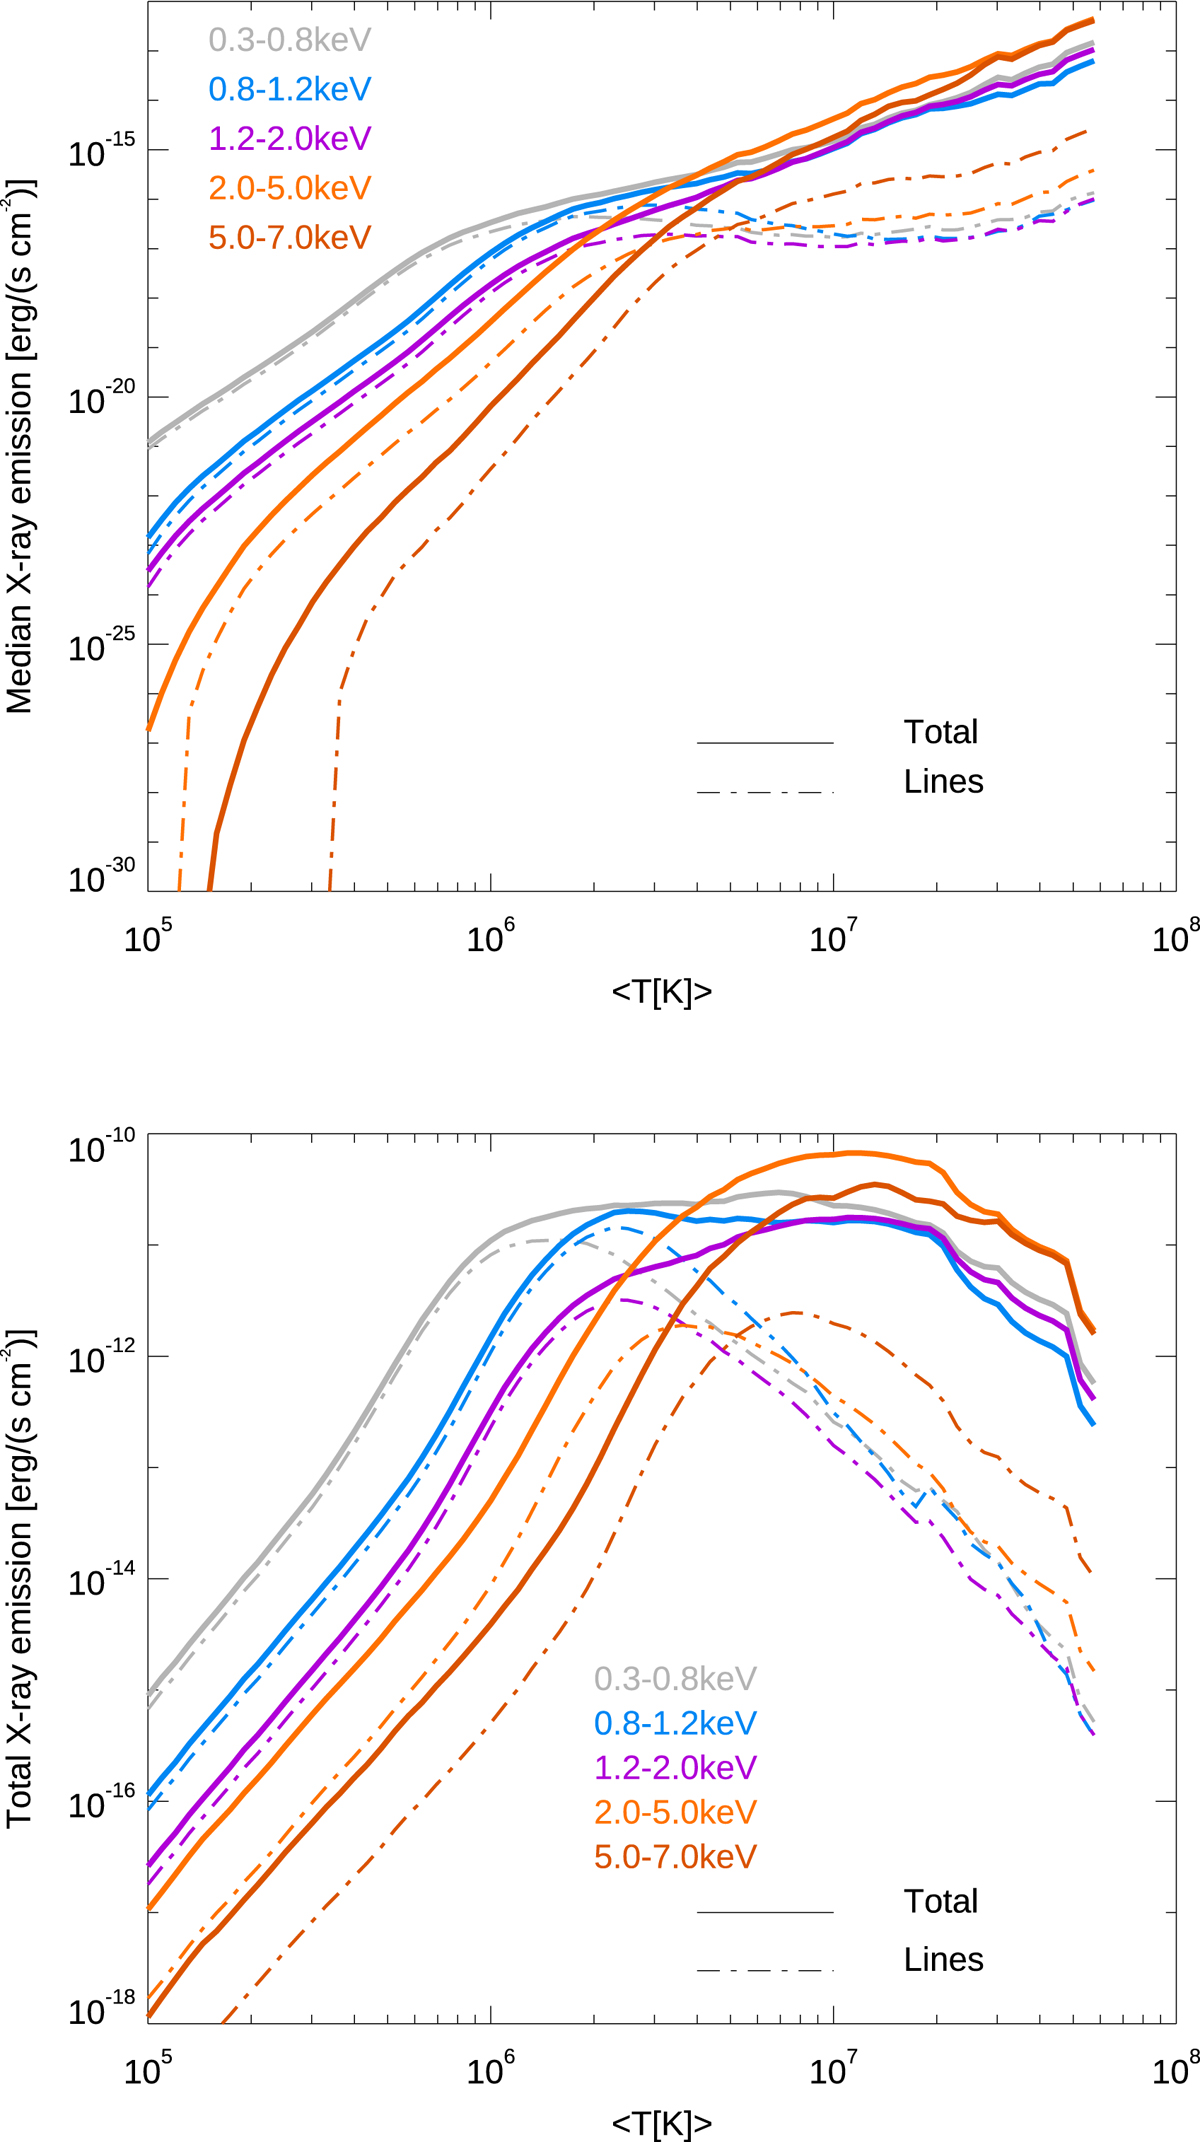
Distribution function of the median X-ray emission (top) and of the total X-ray emission (bottom) for different energy ranges, as a function of the projected mass-weighted temperature of gas in our simulation. The solid lines give the total X-ray emission, while the dot-dashed lines give the contribution only by line emission (assuming a fixed 0.3 Z⊙ metallicity everywhere).
Current usage metrics show cumulative count of Article Views (full-text article views including HTML views, PDF and ePub downloads, according to the available data) and Abstracts Views on Vision4Press platform.
Data correspond to usage on the plateform after 2015. The current usage metrics is available 48-96 hours after online publication and is updated daily on week days.
Initial download of the metrics may take a while.